How Healthy Are Our Watersheds?
Ways to Protect Our Watersheds
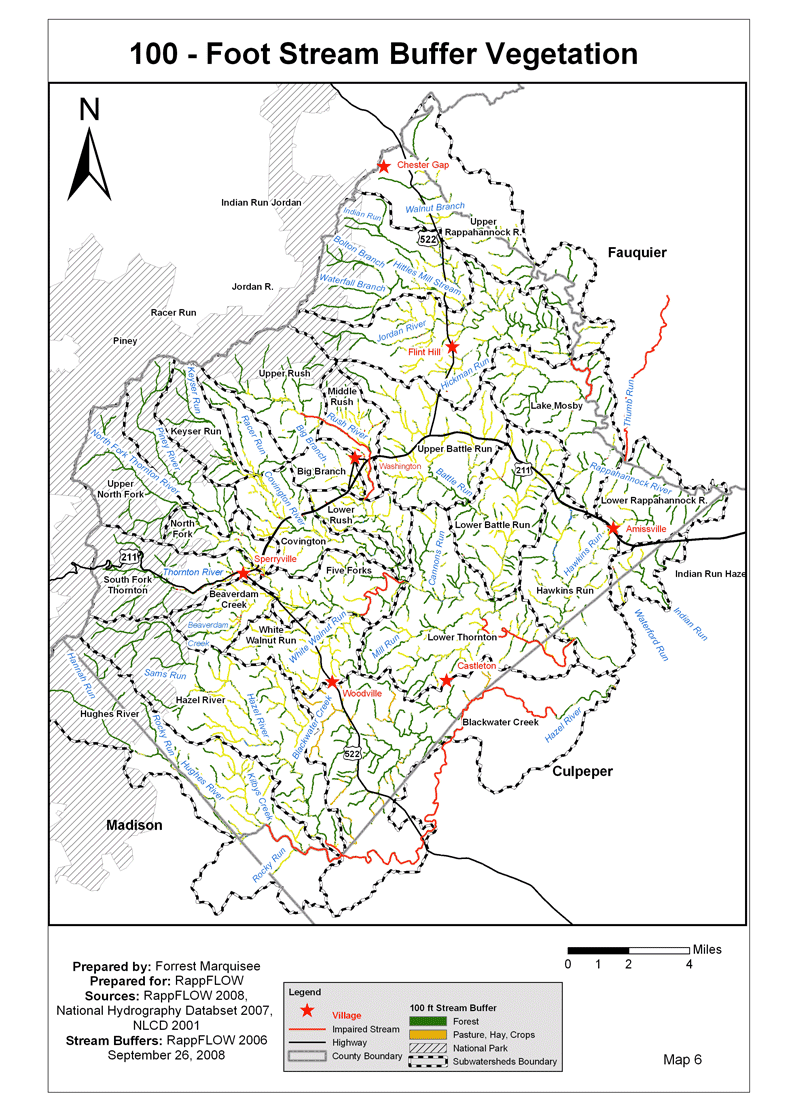
Stream Buffers
-Riparian Buffer & Rain Garden
-Buffer Handbook
-Sources of native plants
Upper Thornton River Watershed Study
RappFLOW is a member of the Orion Grassroots Network
People, Land and Water at the
Headwaters of the
Rappahannock River Basin
Table of Contents
2.1 Purposes of this work
2.2 Overview of Rappahannock County’s People, Land, and Water
2.3 Watershed Protection versus Watershed Restoration
3 What factors can we use to assess the health and protection of our watersheds?
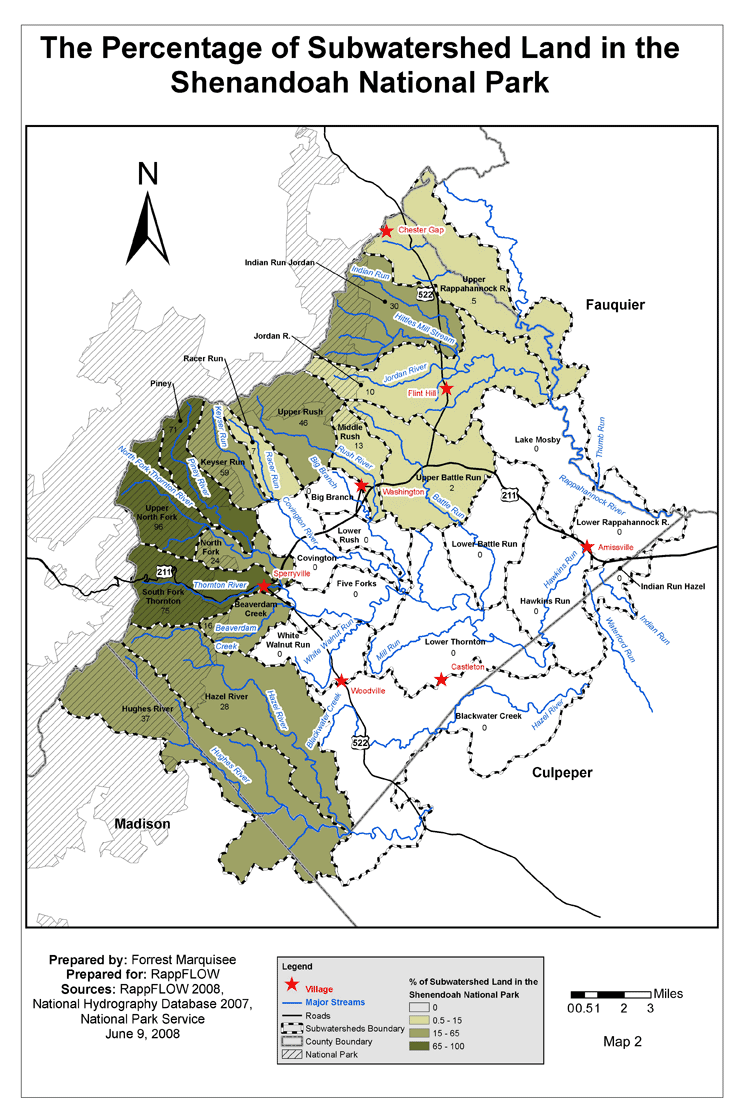
3.1 Shenandoah National Park (SNP)
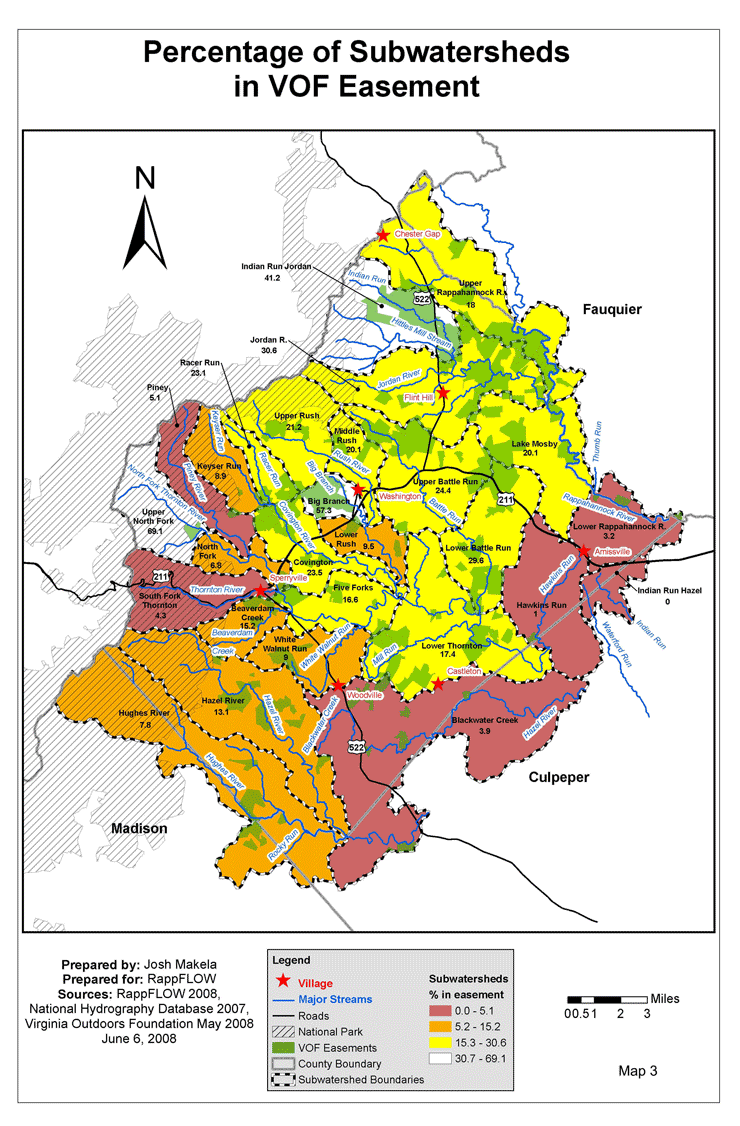
3.2 Conservation Easements
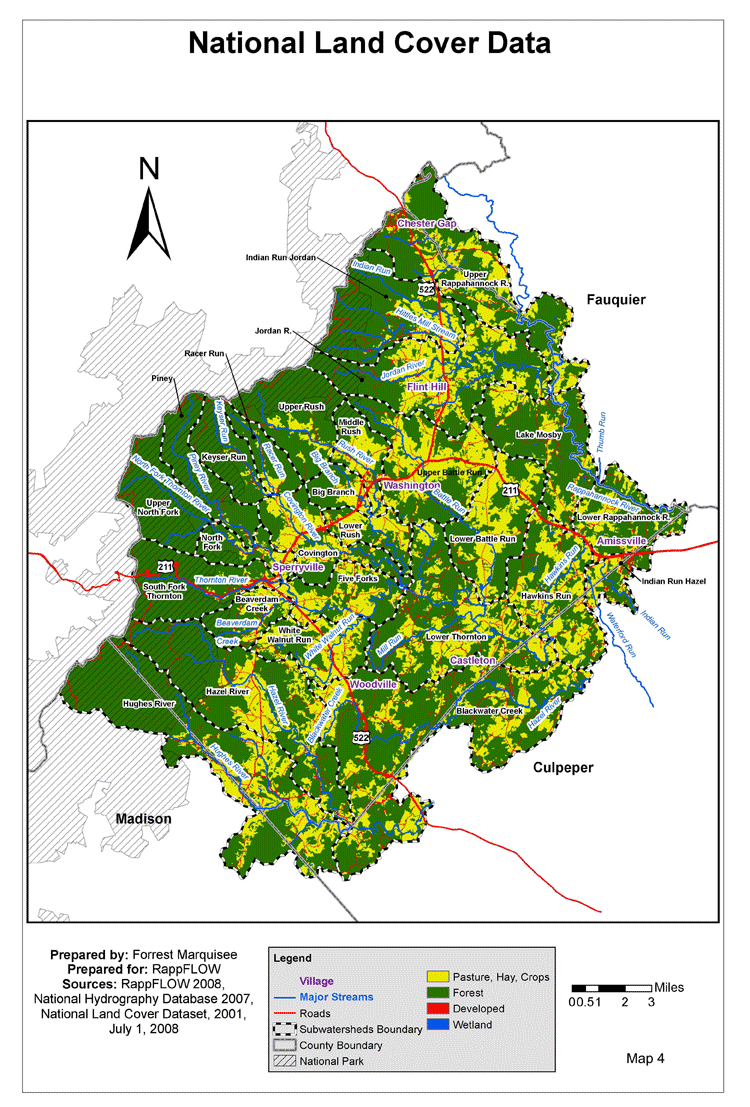
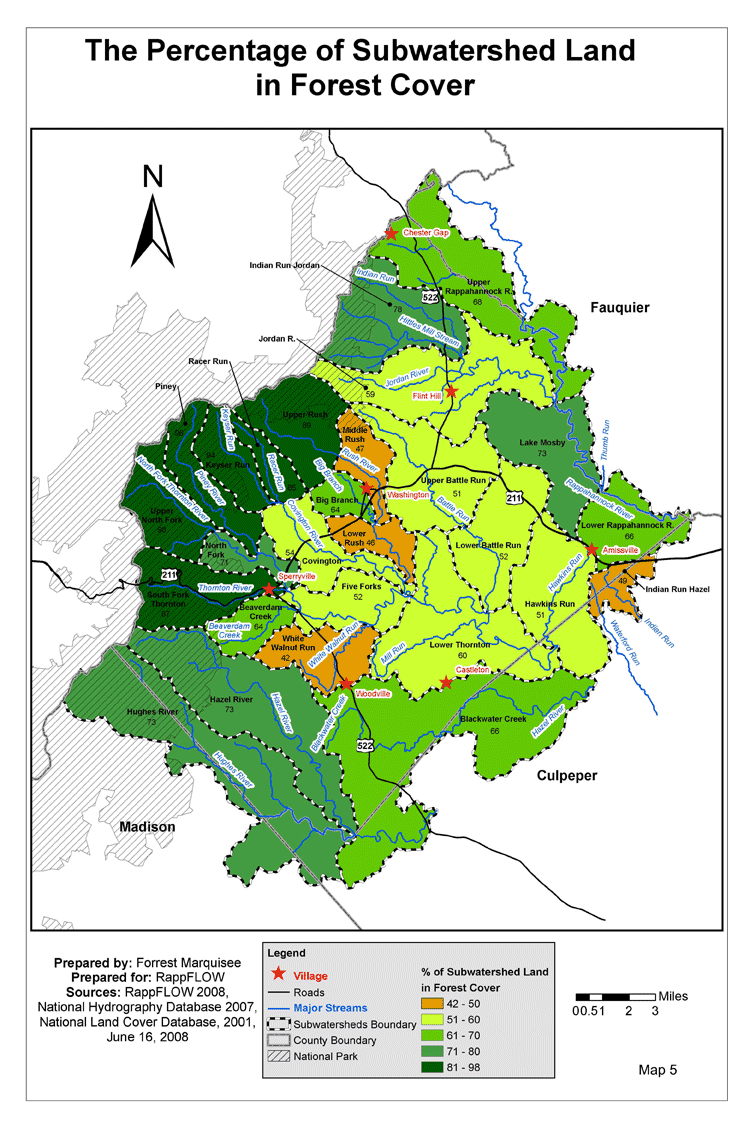
3.3 Land Cover
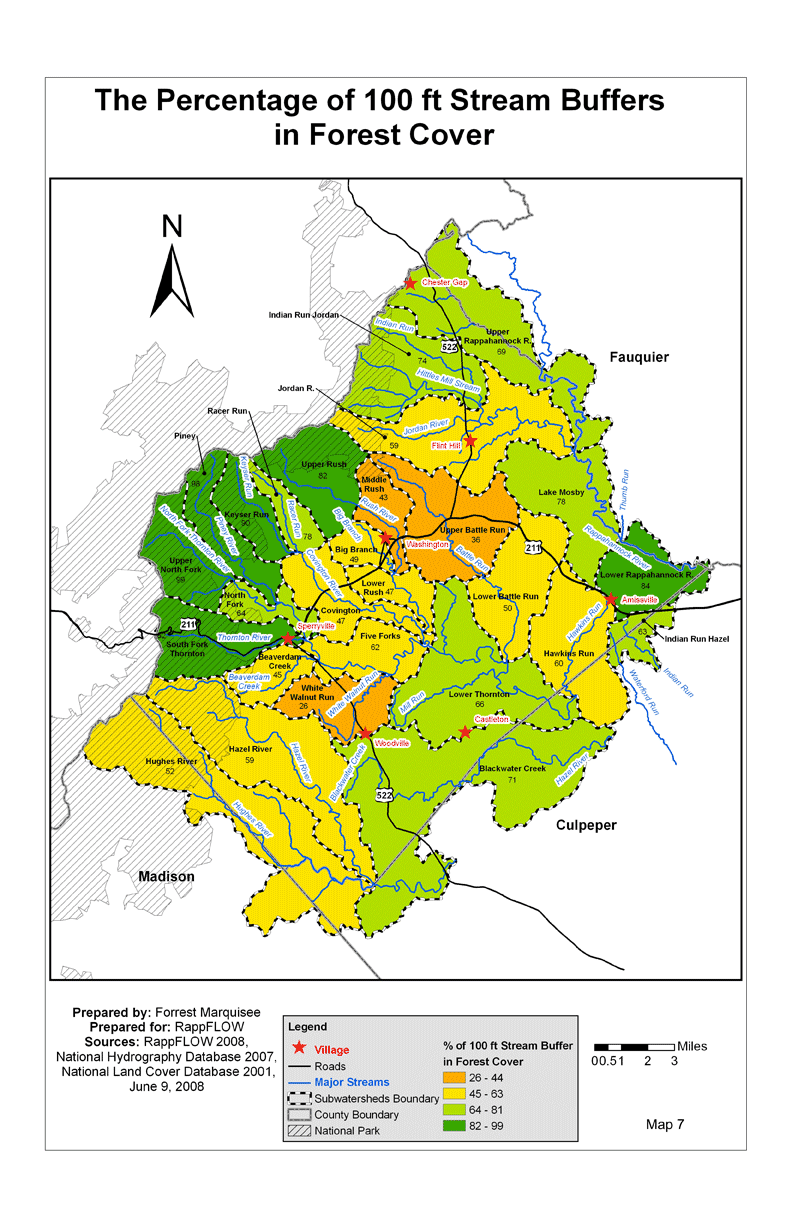
3.4 Forested Stream Buffers
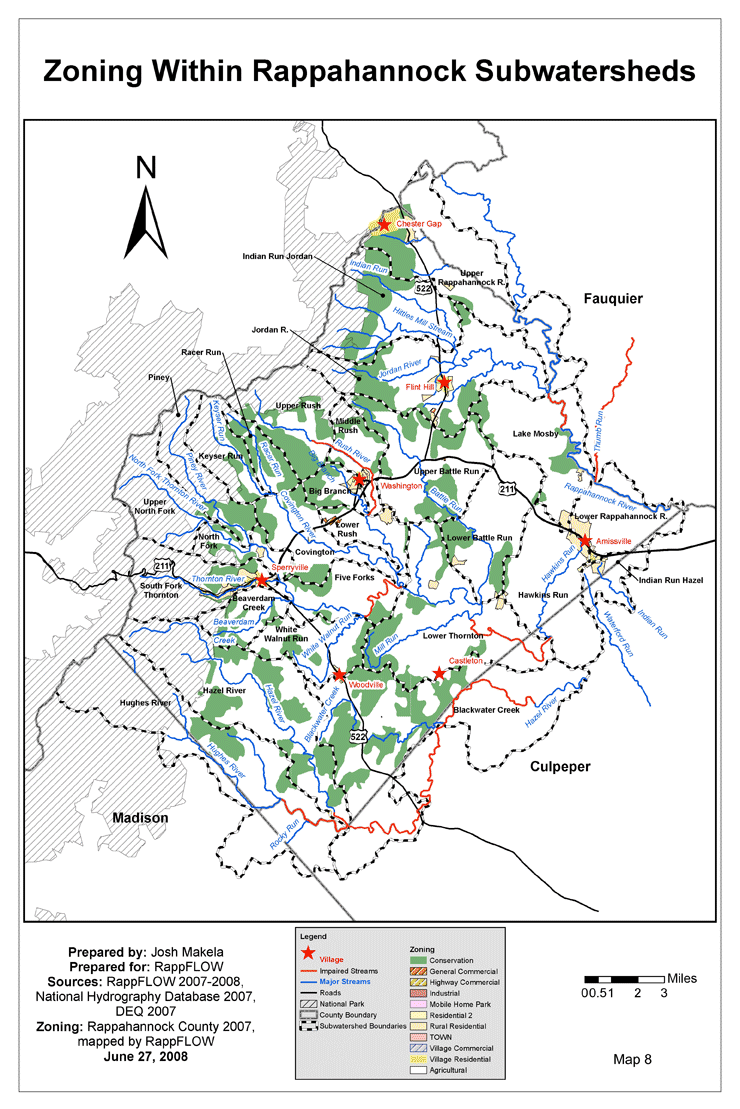
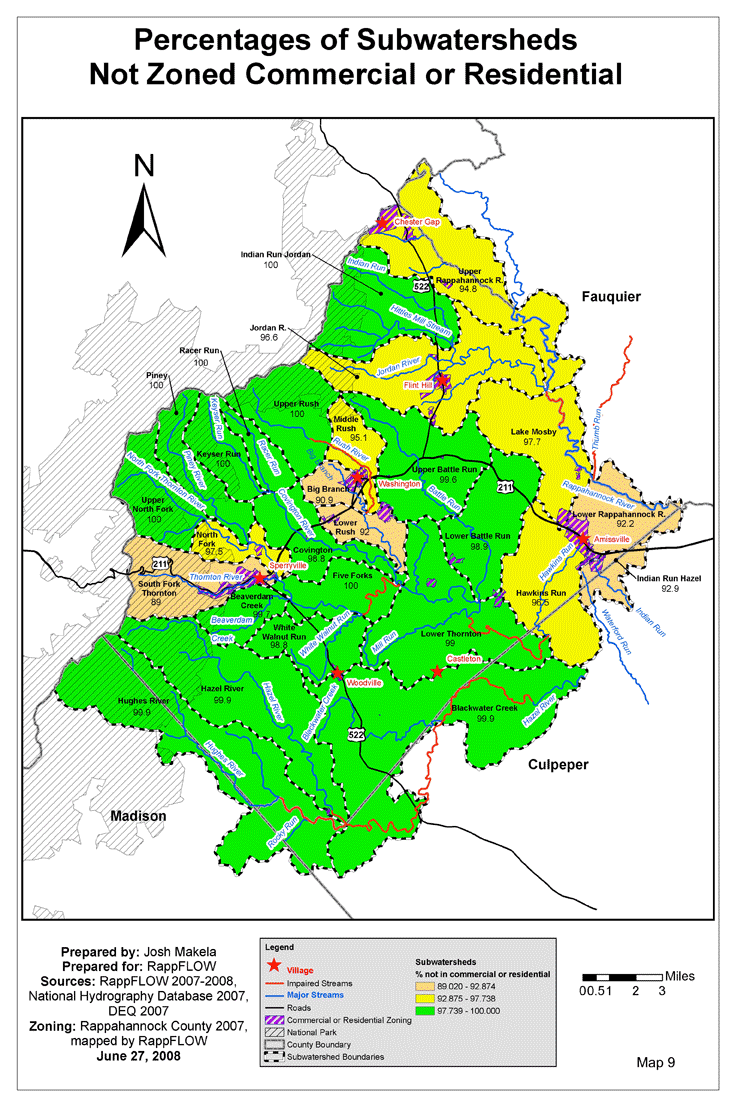
3.5 Zoning
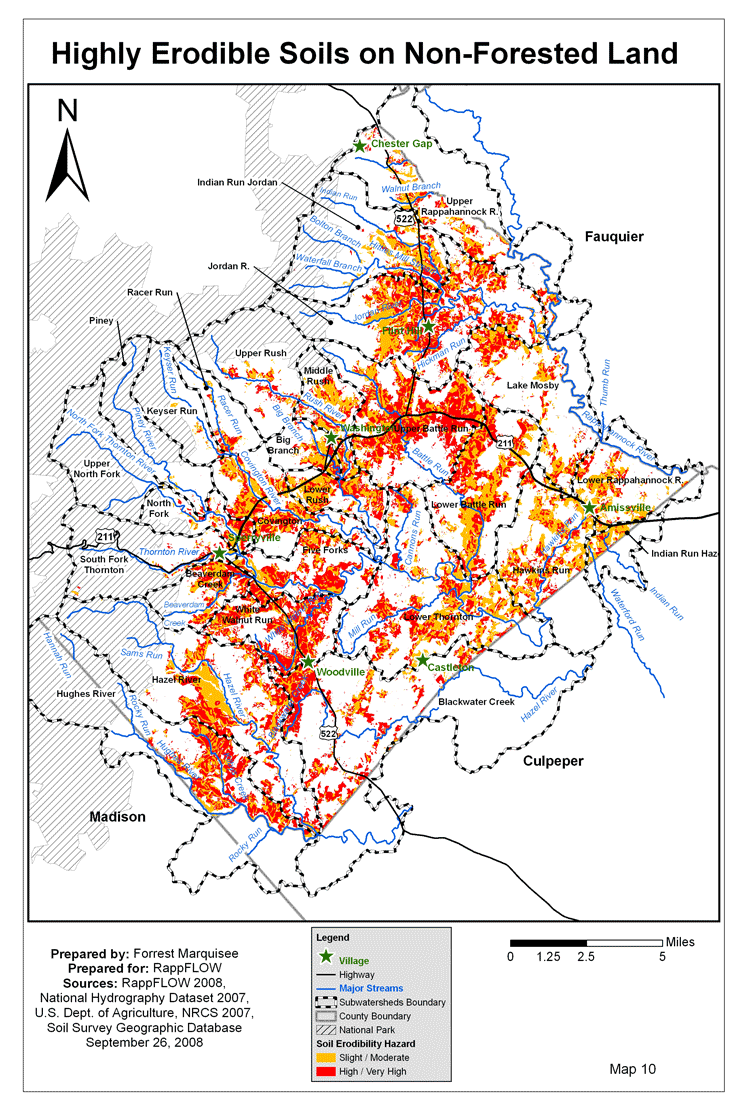
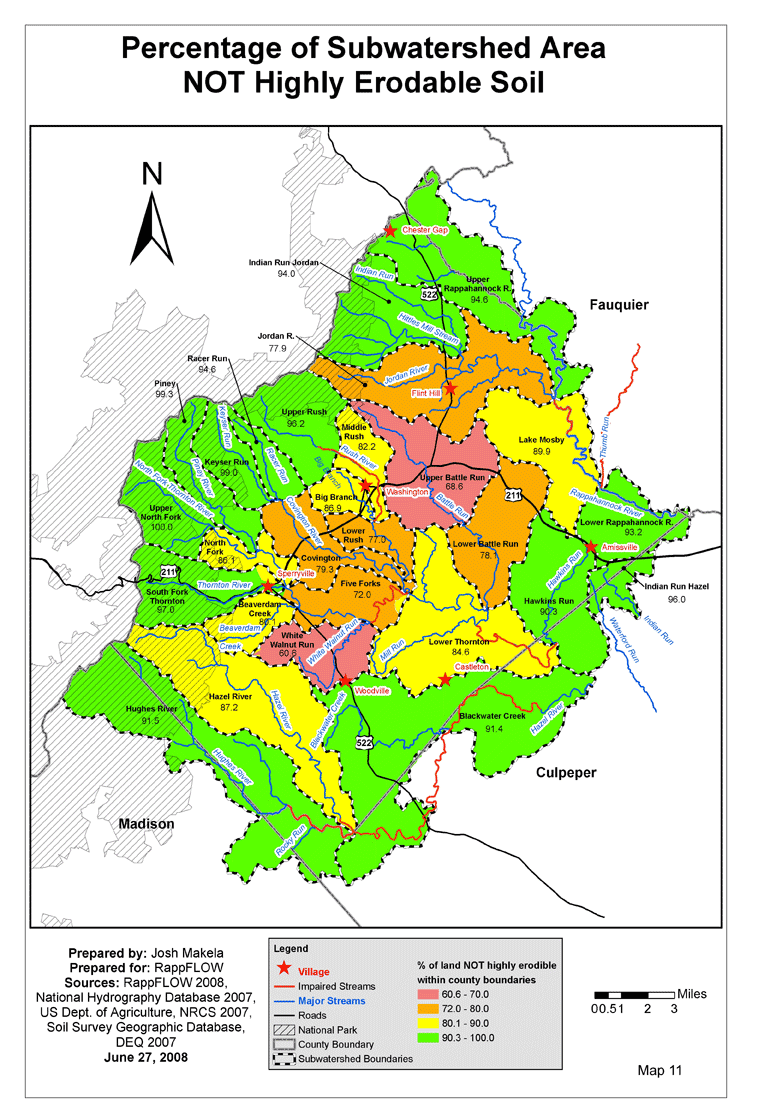
3.6 Erodible Soils on Non-forested Land
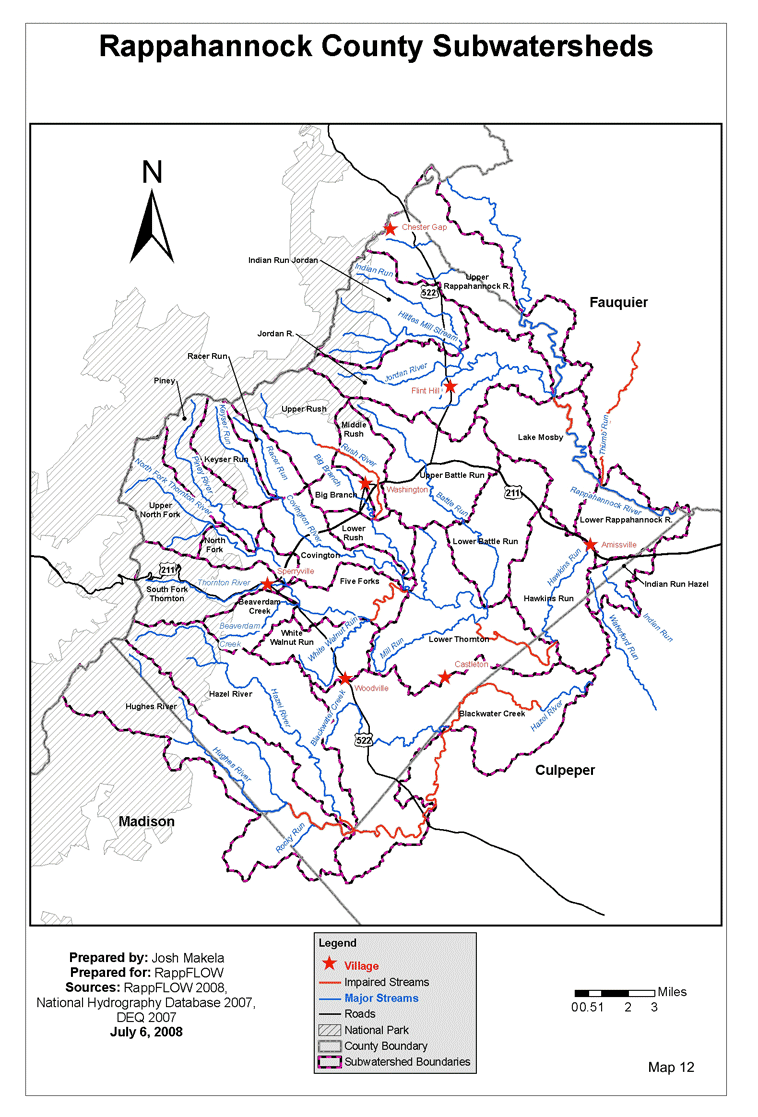
4 What and Where are the County’s Subwatersheds?
5 How well protected are our watersheds?
5.1 Comparisons with an “ideal”
5.2 Comparisons with poorly protected areas elsewhere
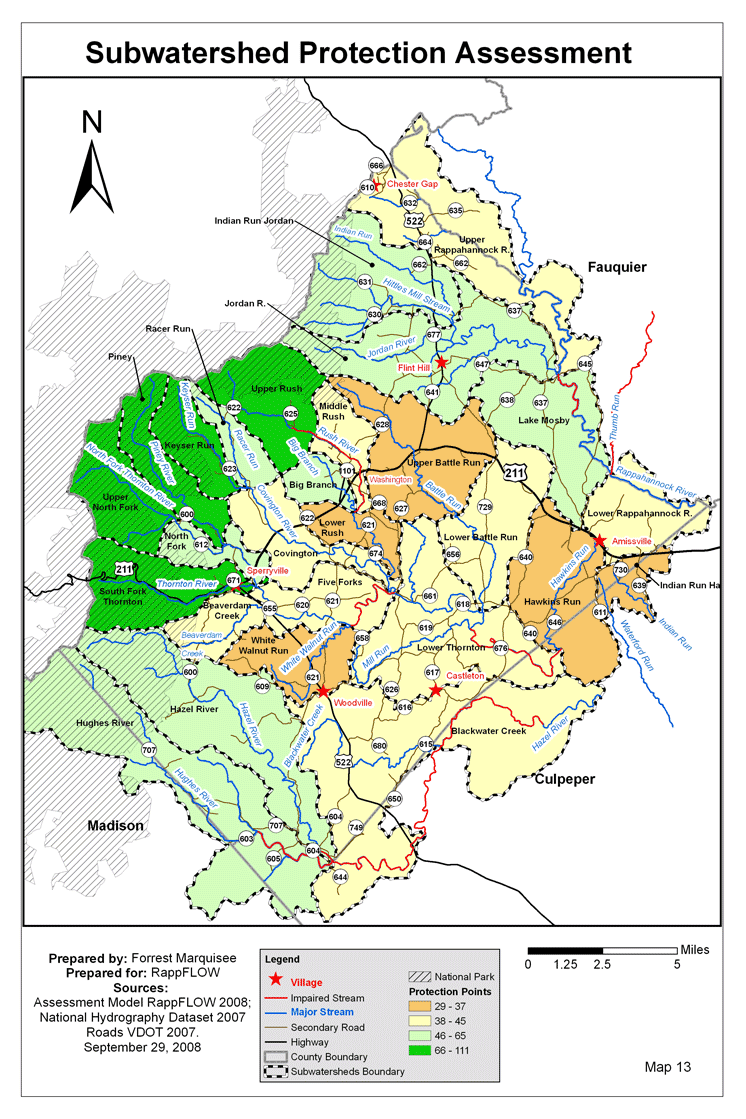
5.3 How did we quantify the protection level of subwatersheds in the model?
5.4 Comparing the subwatersheds’ protection levels
5.5 Using the subwatershed protection map
6 Values, concerns, and knowledge of those who own or use the land
6.1 Mailed questionnaire surveys
6.2 Consultations with individual landowners
6.3 Participation in Public Hearings
6.4 Subwatershed Landowner Groups
7 Public Policy: Local Government Protections for Watersheds
7.1 Comprehensive Land Use Plan, especially Chapter 6: Goals, Principles and Policies
7.2 Zoning and subdivision ordinances
7.3 Stream Buffer Protection Overlay (SPO) District of the Zoning Ordinance
7.4 Erosion & Sediment Control Ordinance
7.5 Biosolids Ordinance
7.6 Stormwater Management Ordinance
7.7 Land use taxation
7.8 Agricultural and Forestal Districts
7.9 Farmland Preservation Program
7.10 Septic System Cost Sharing Program
8 Taking a Closer Look at Watershed Health and Protection
8.1 Future development
8.2 Climate change
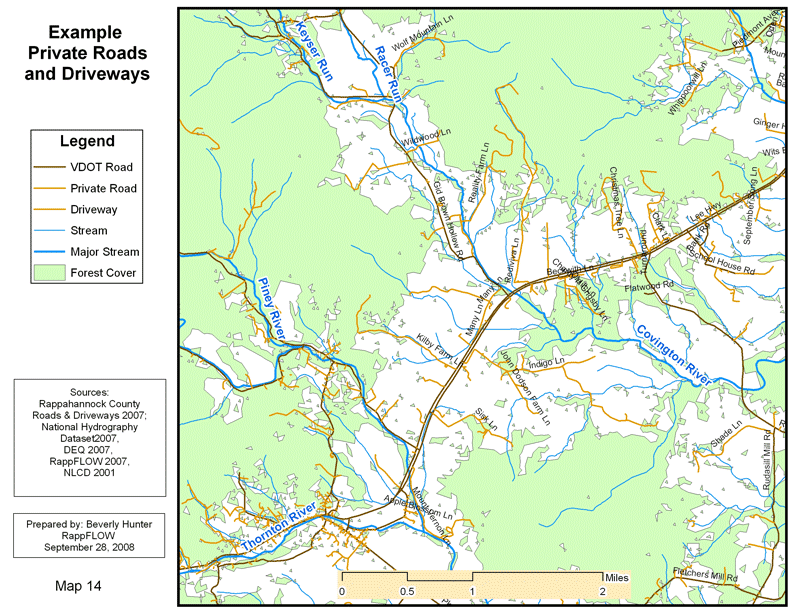
8.3 Private roads and driveways
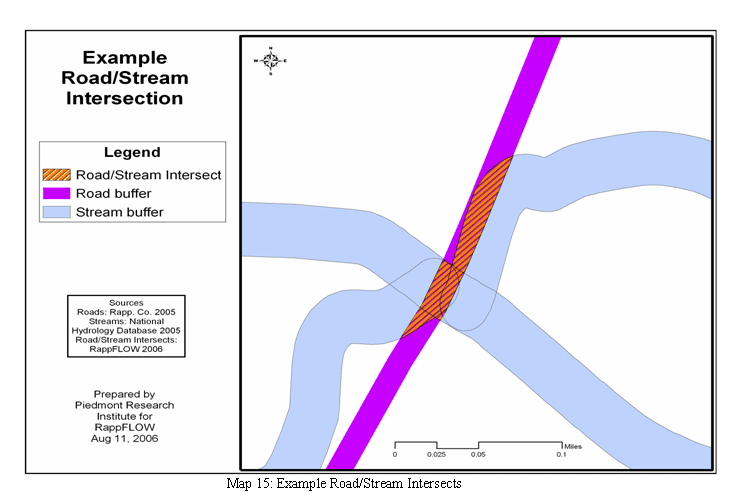
8.4 Road/stream crossings
8.5 Stability of Streambeds
8.6 Residential and commercial landscaping and land management practices
8.7 Agricultural land management practices
8.8 Forest management
8.9 Sewage treatment plants
8.10 Septic systems
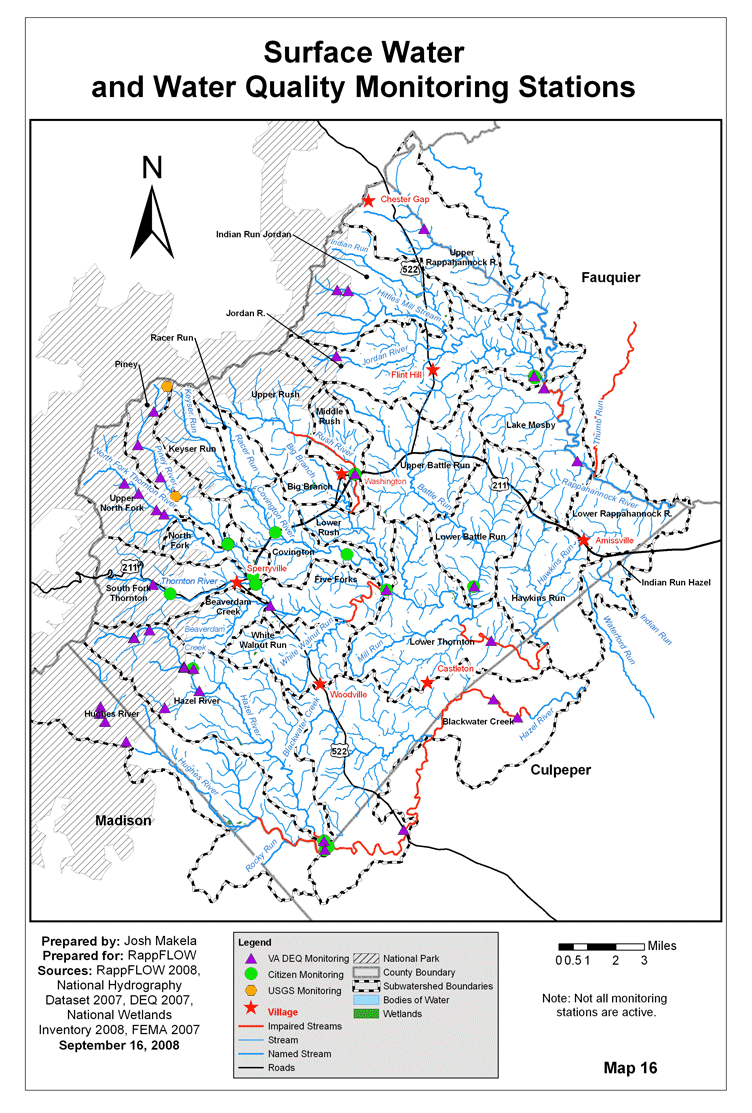
9 Indicators of water quality and quantity
9.1 Impaired stream segments: what they mean and do not mean
9.2 DEQ Ambient Monitoring Stations Data
9.3 Citizen Macroinvertebrate Monitoring Stations.
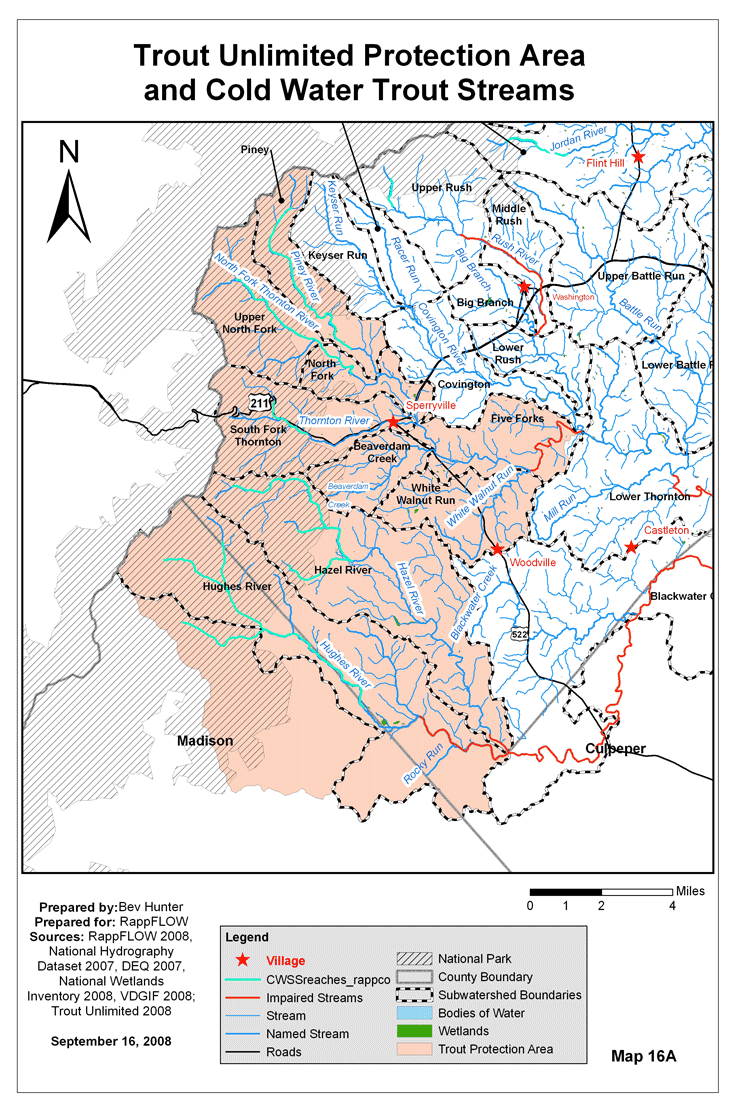
9.4 Coldwater Streams and Brook Trout Protection Area
9.5 Special water quality studies
9.6 Precipitation and Surface Water Flow Measurements
9.7 Ground Water Measurements
9.8 Quantity and Quality of Well Water
10 Least-protected subwatersheds: The Lower Rush
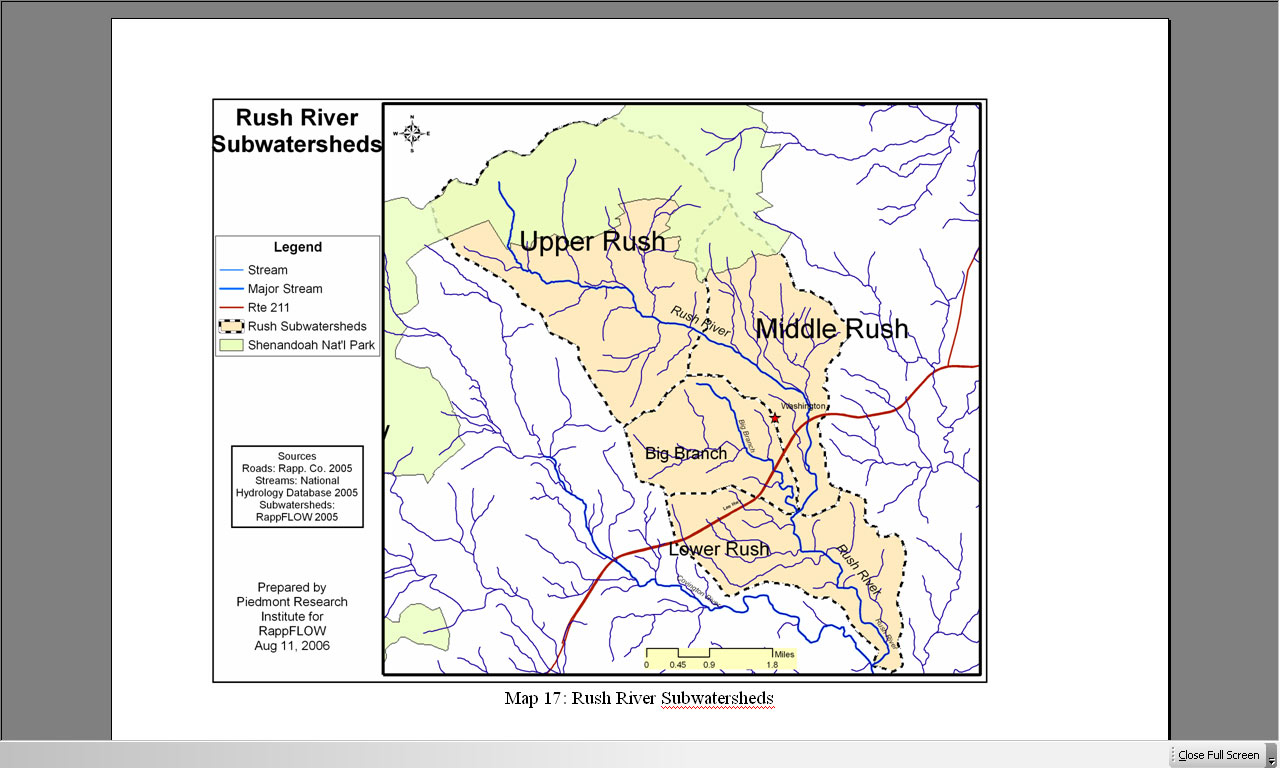
10.1 Rush River and Tributary Streams
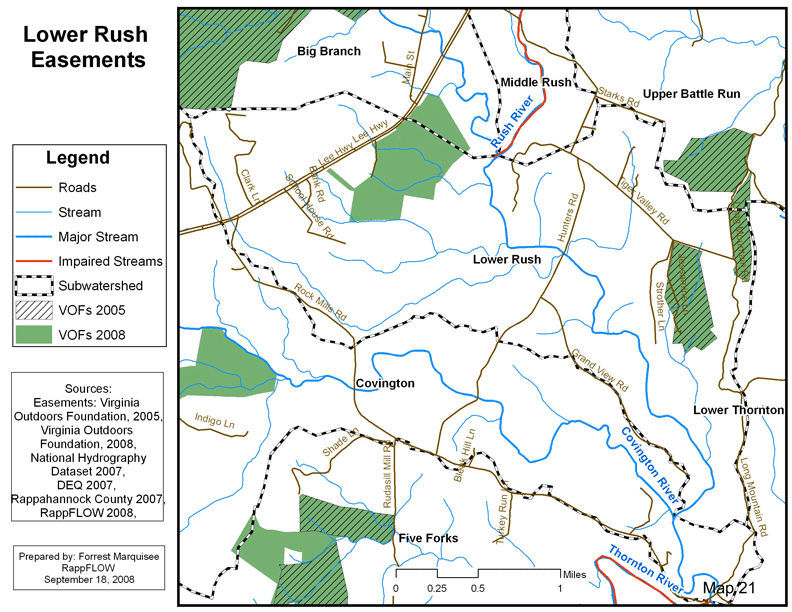
10.2 Lower Rush Easements
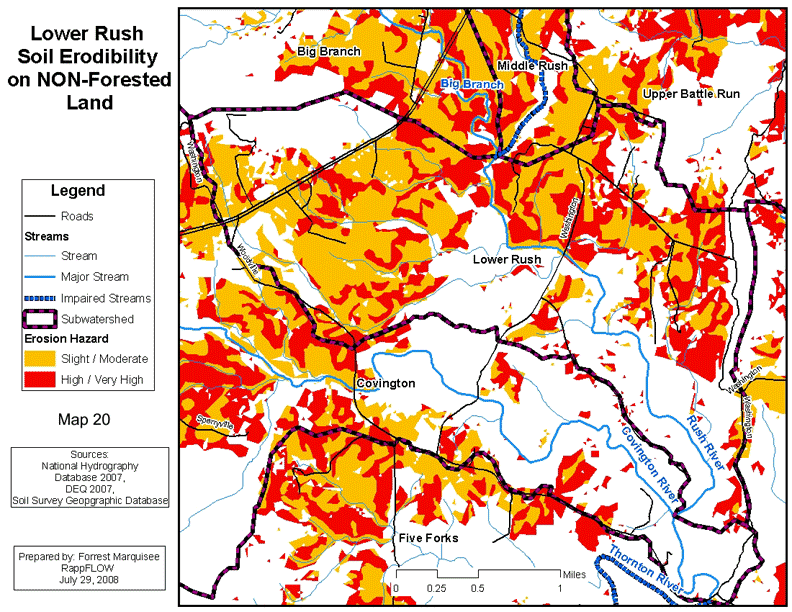
10.3 Lower Rush Topography and Soils
10.4 Streams, ponds, wetlands and floodplains in the Lower Rush subwatershed
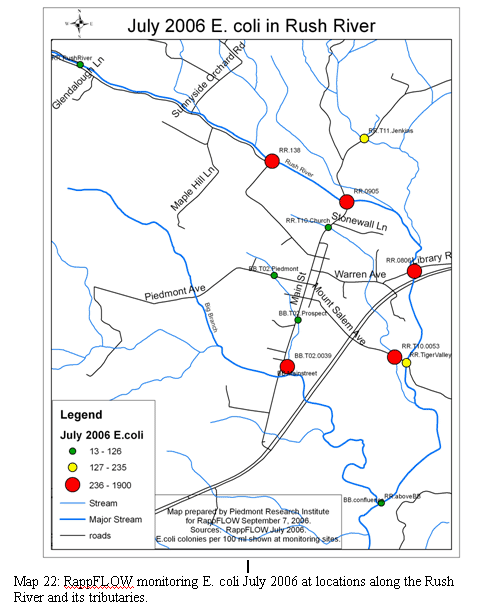
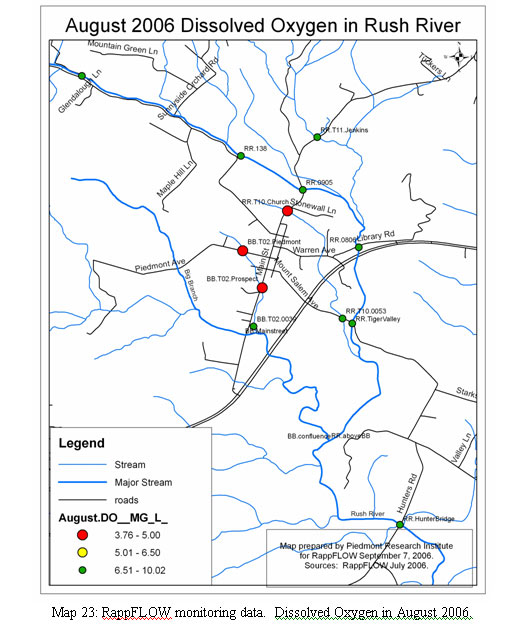
10.5 Water Quality – Rush River
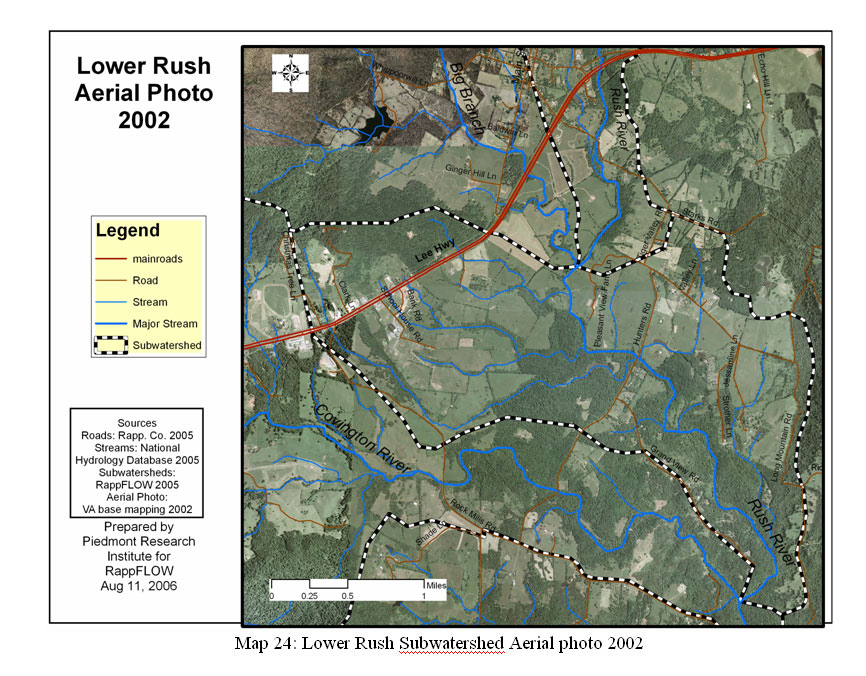
10.6 How is the land used in the Lower Rush Subwatershed?
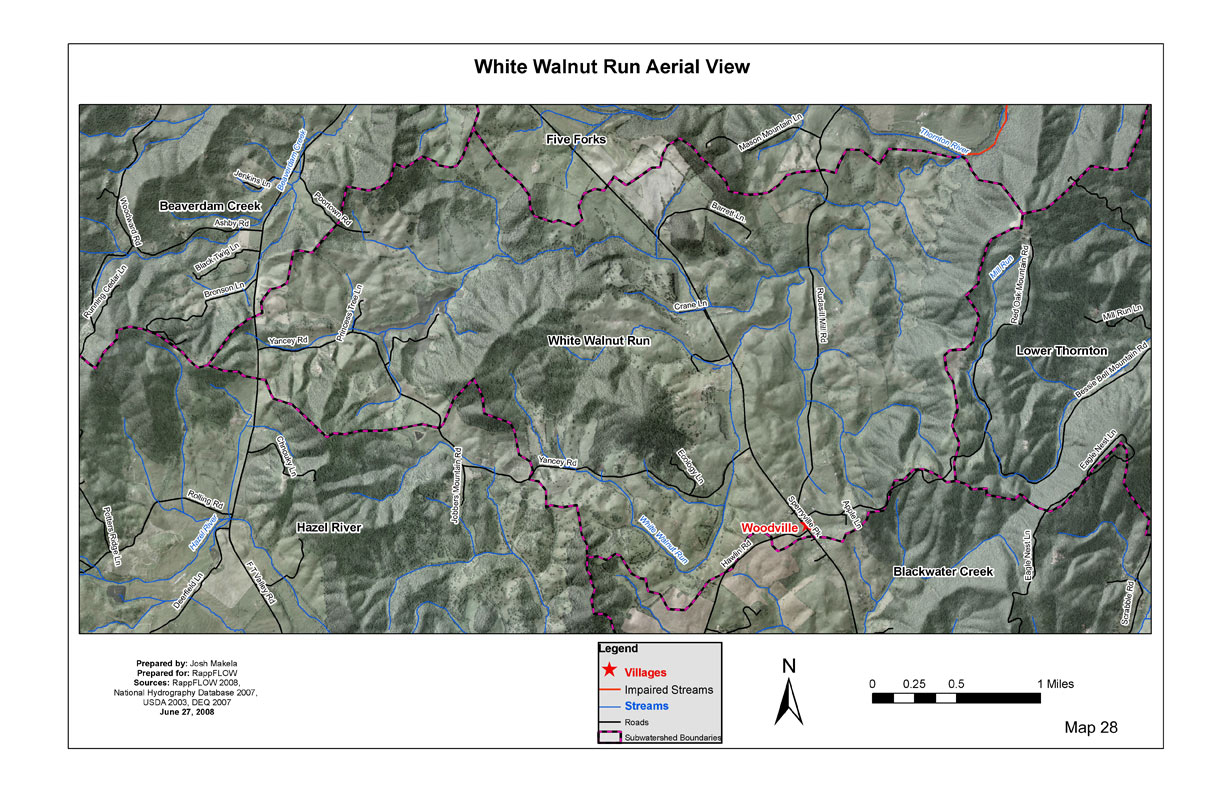
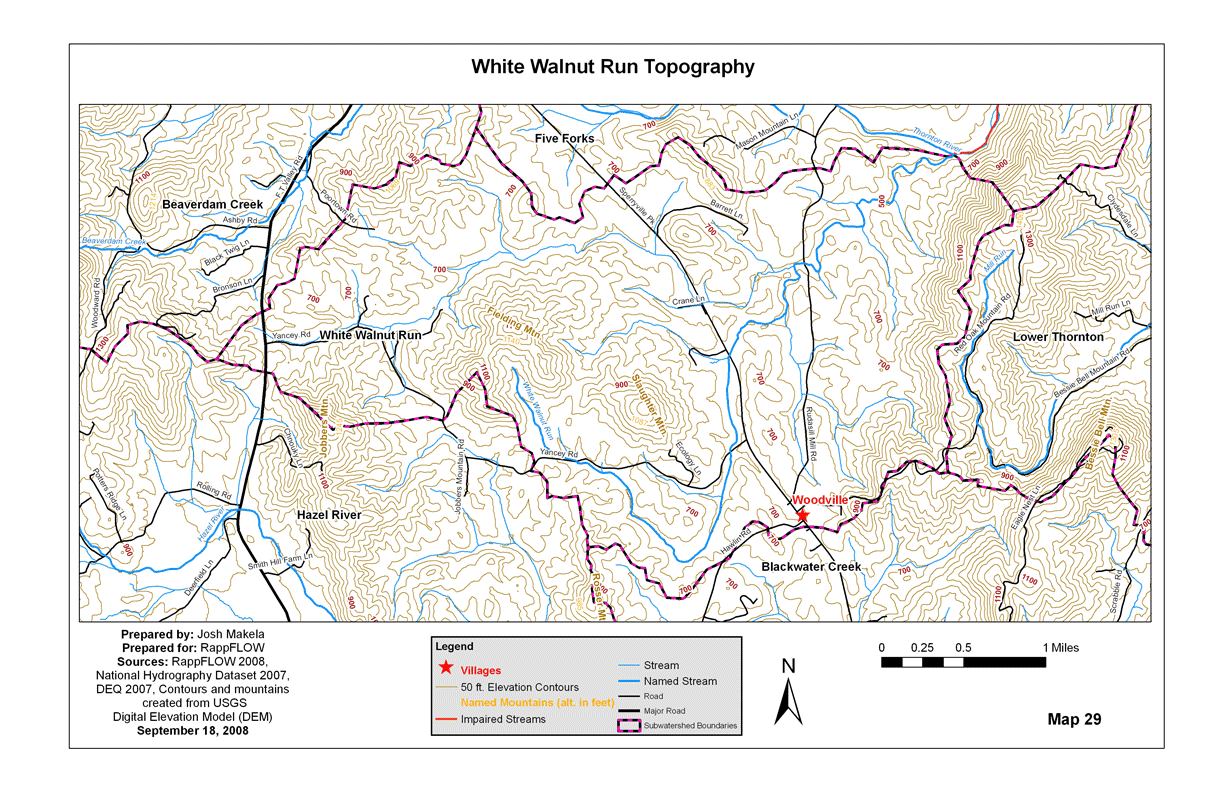
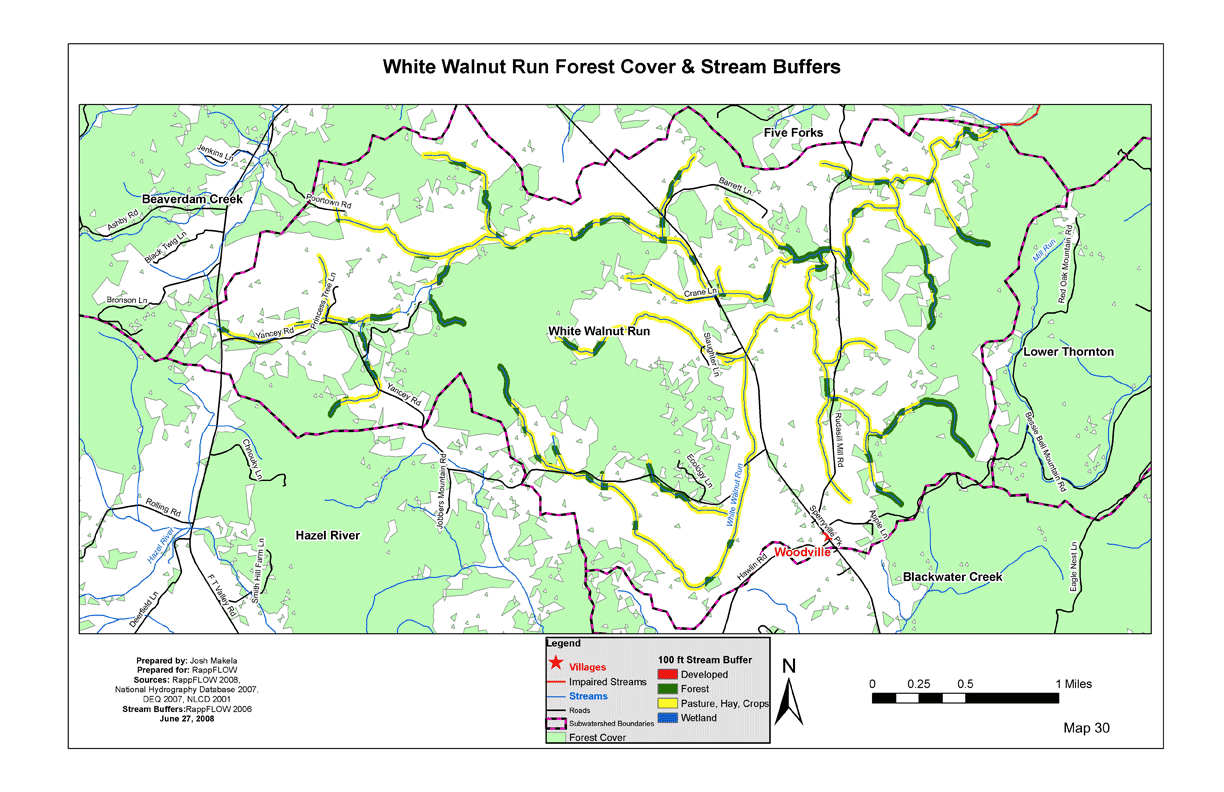
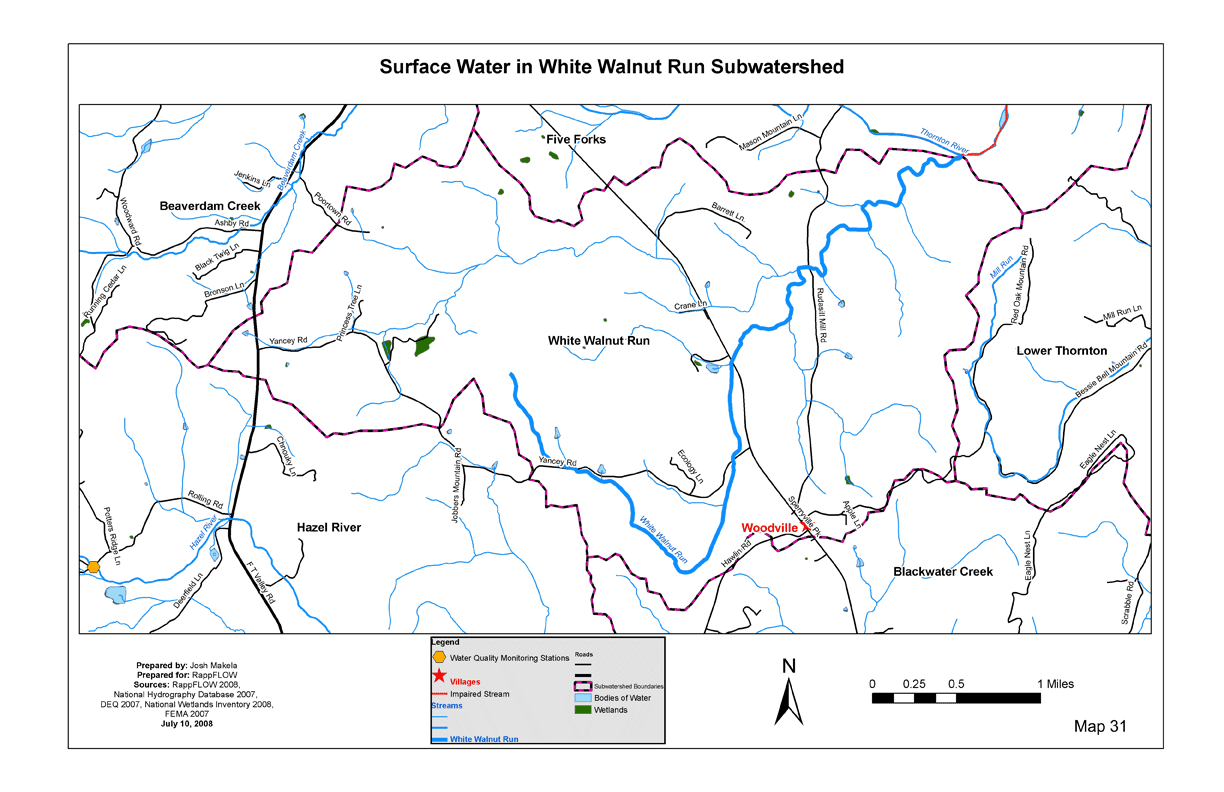
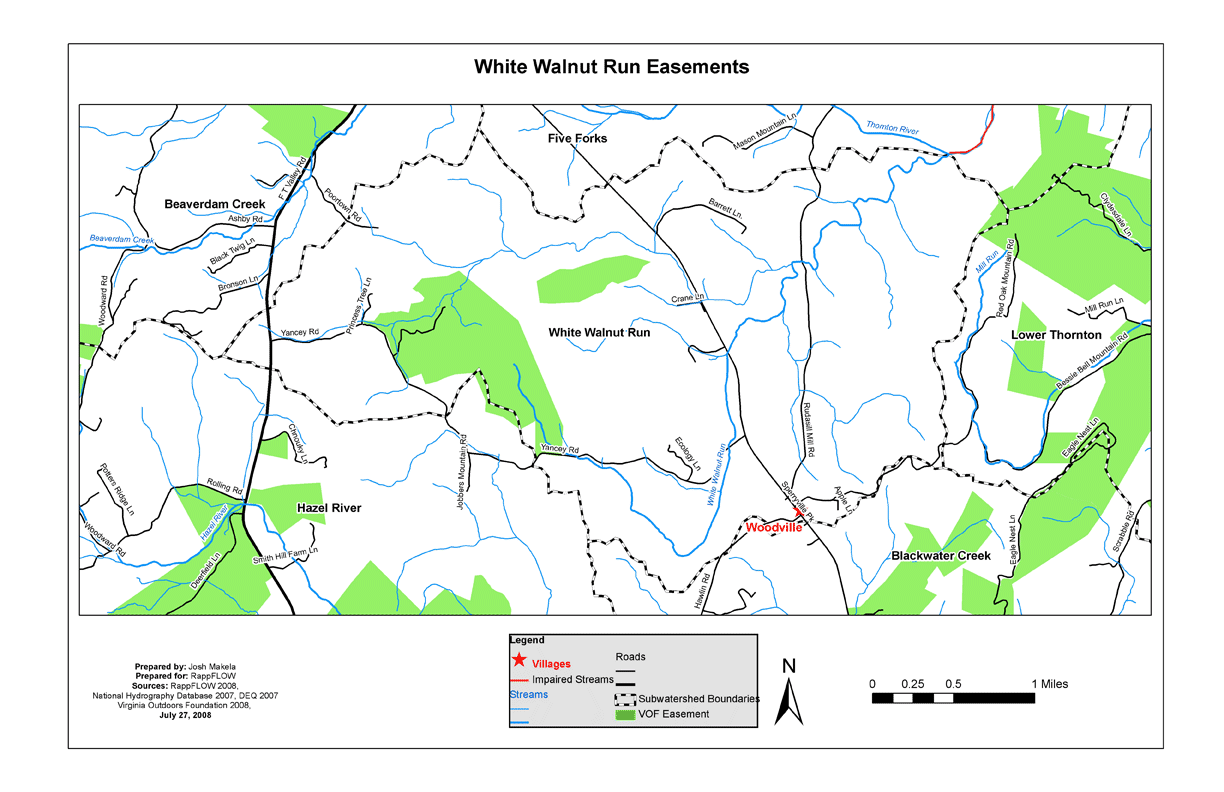
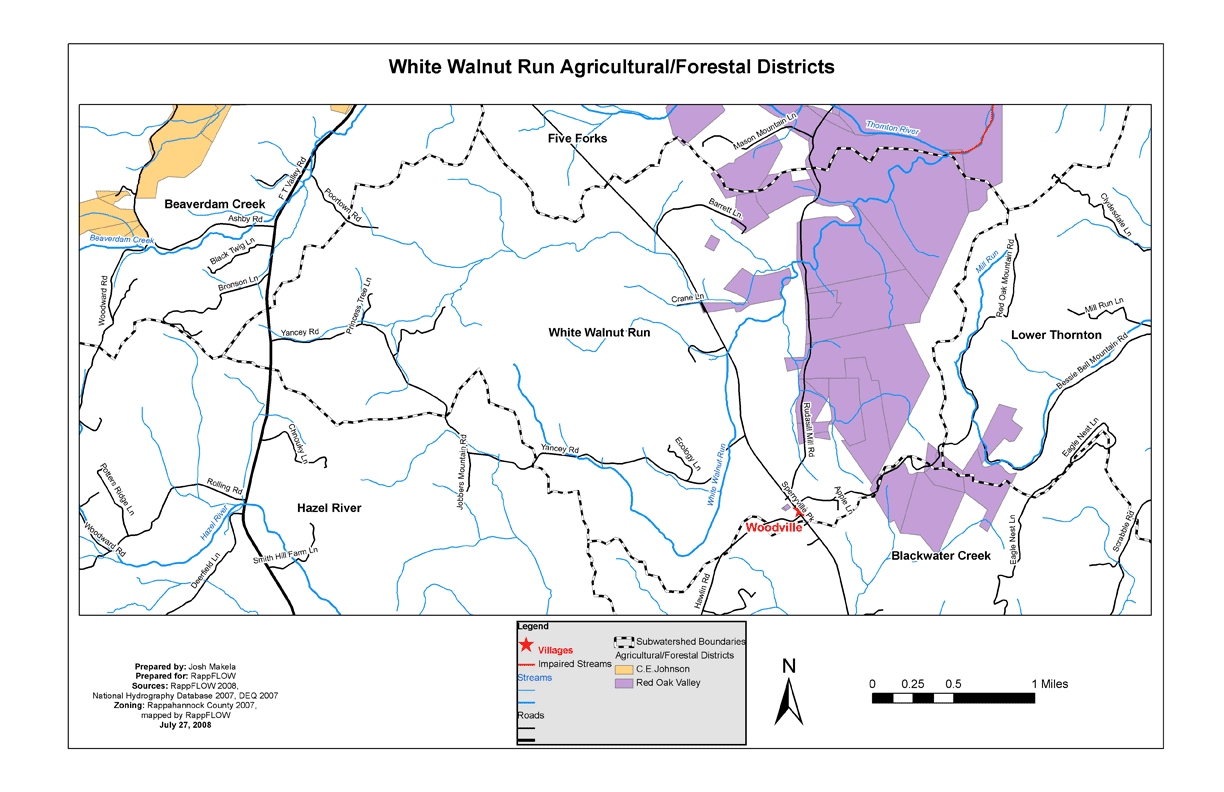
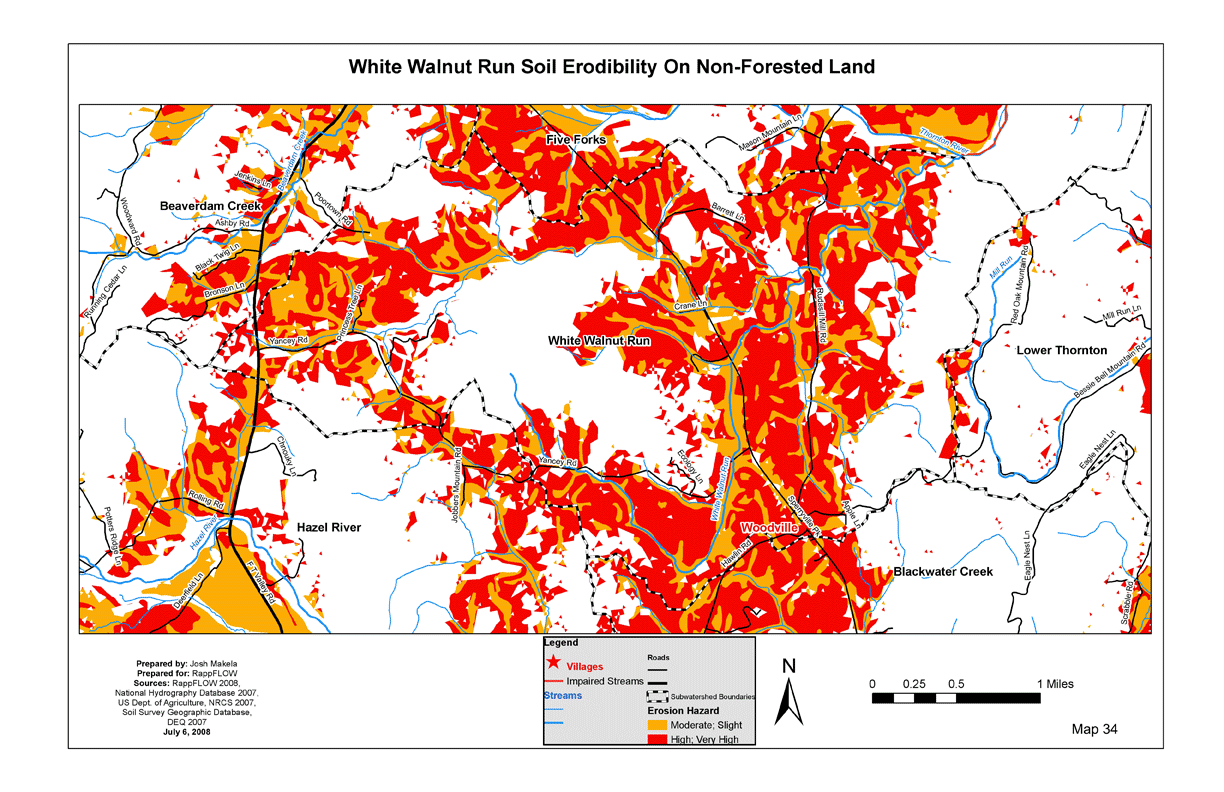
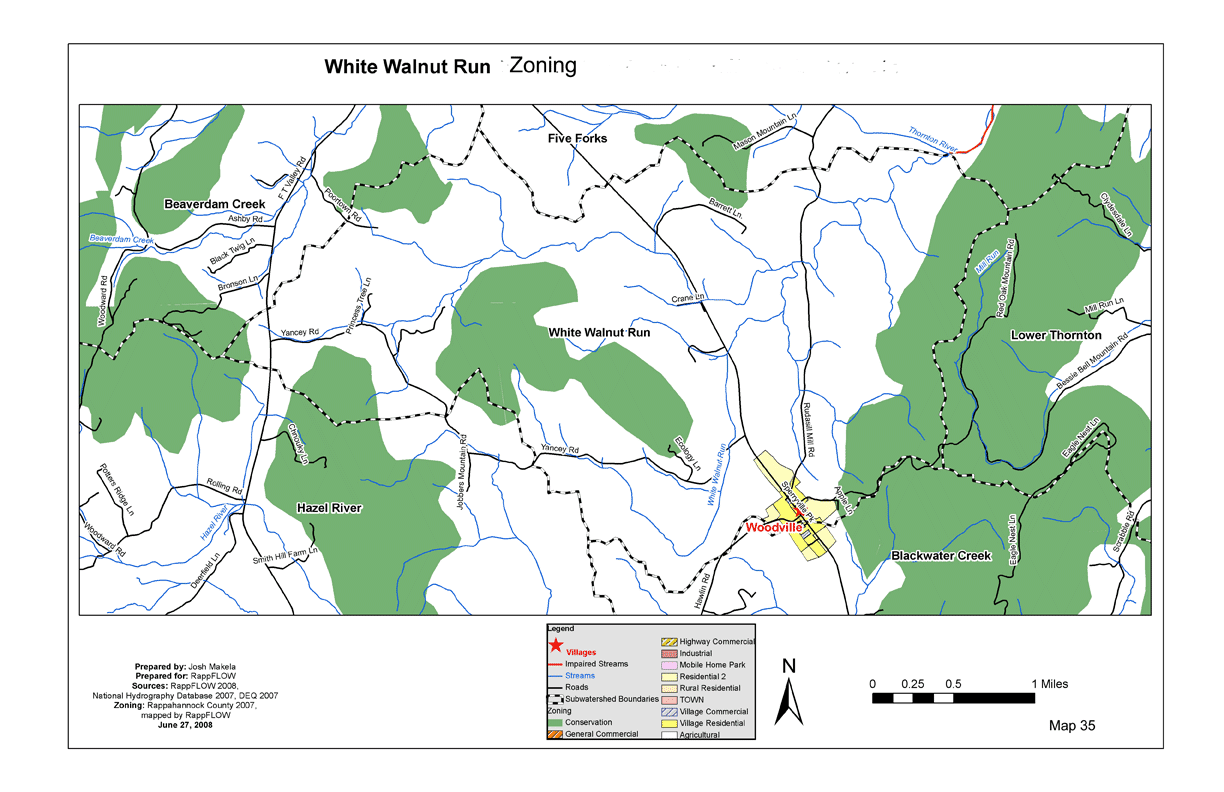
11 Least-protected subwatersheds: White Walnut Run
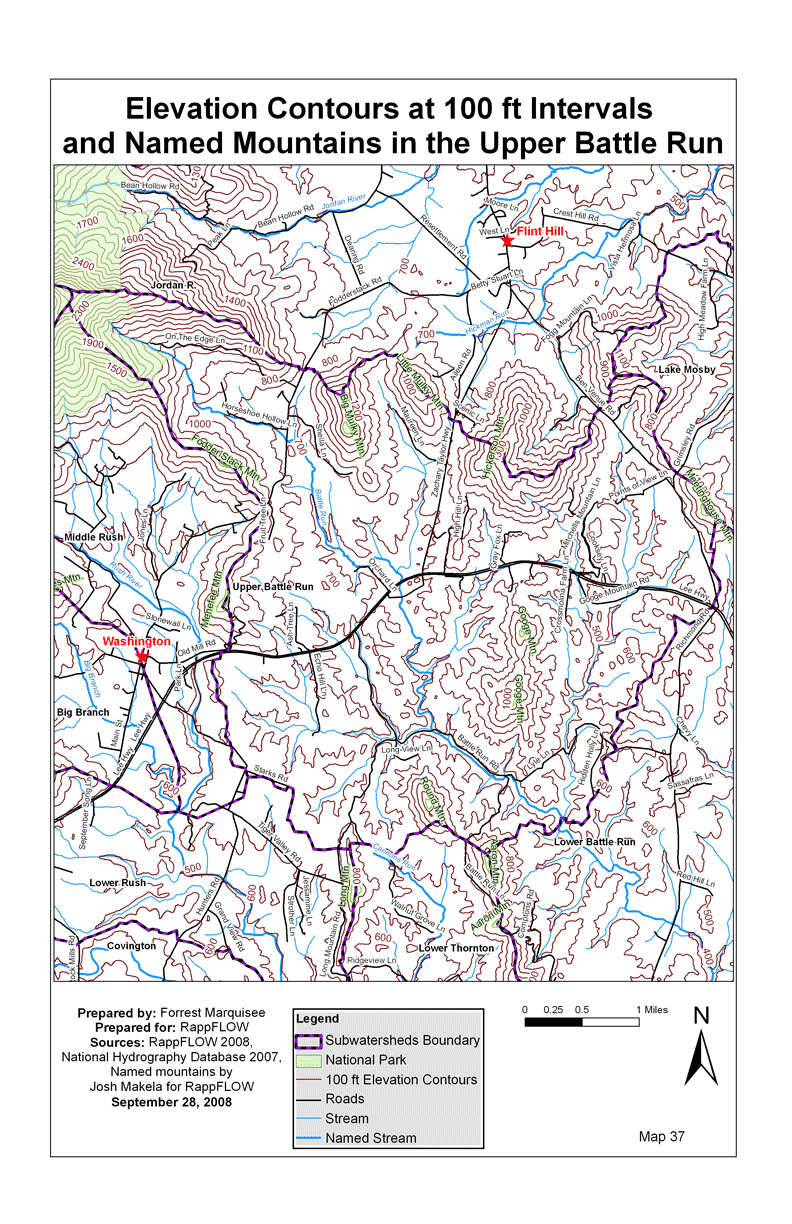
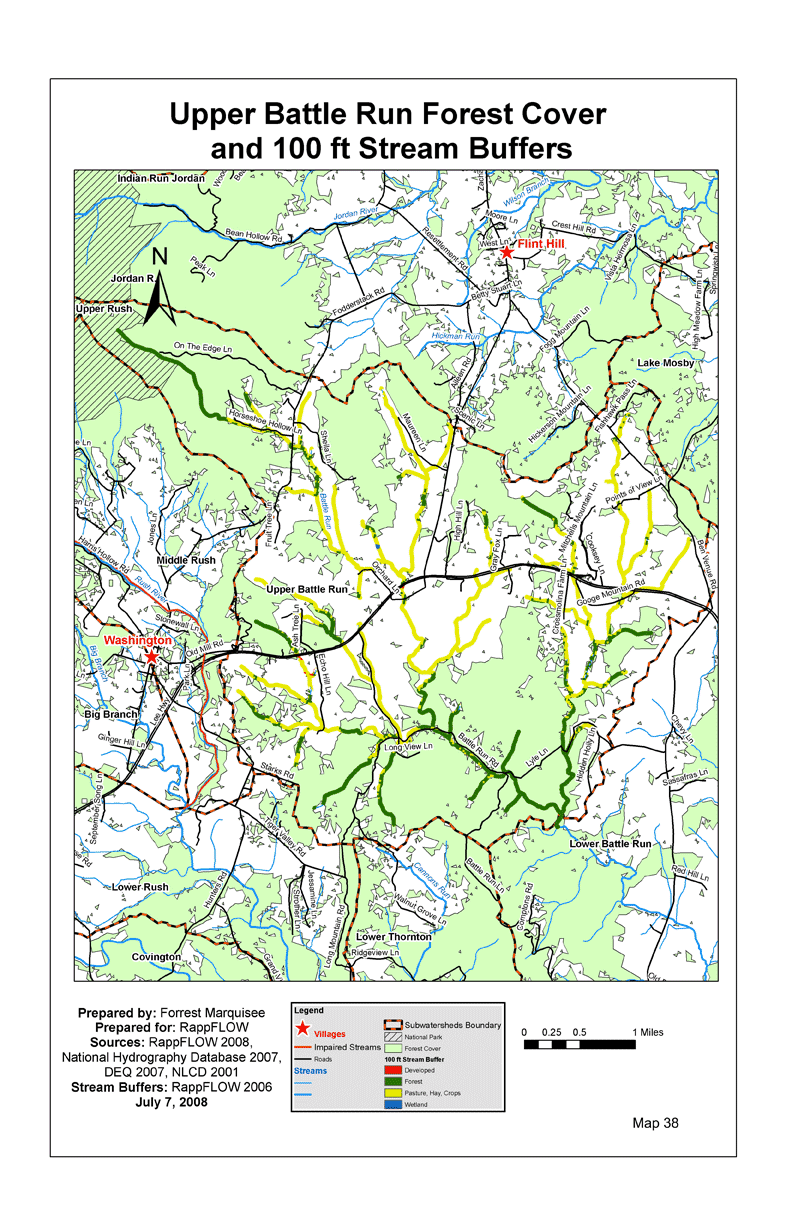
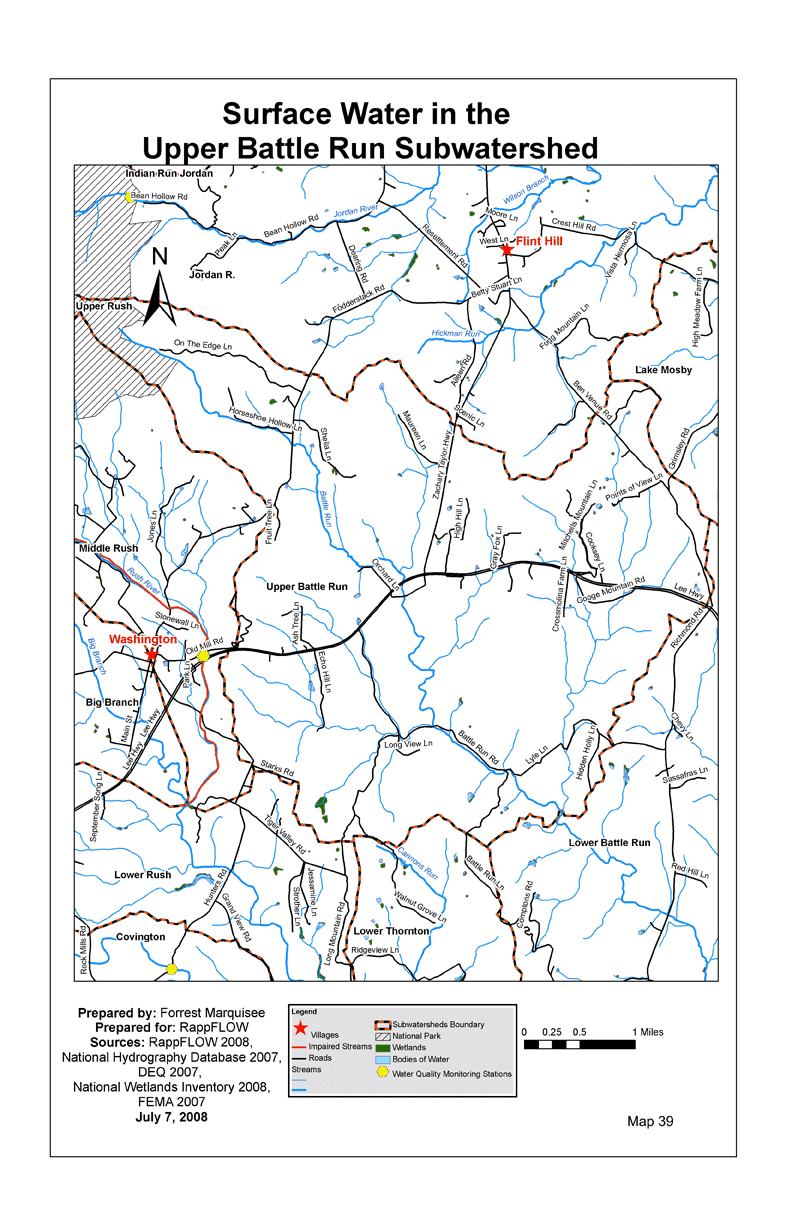
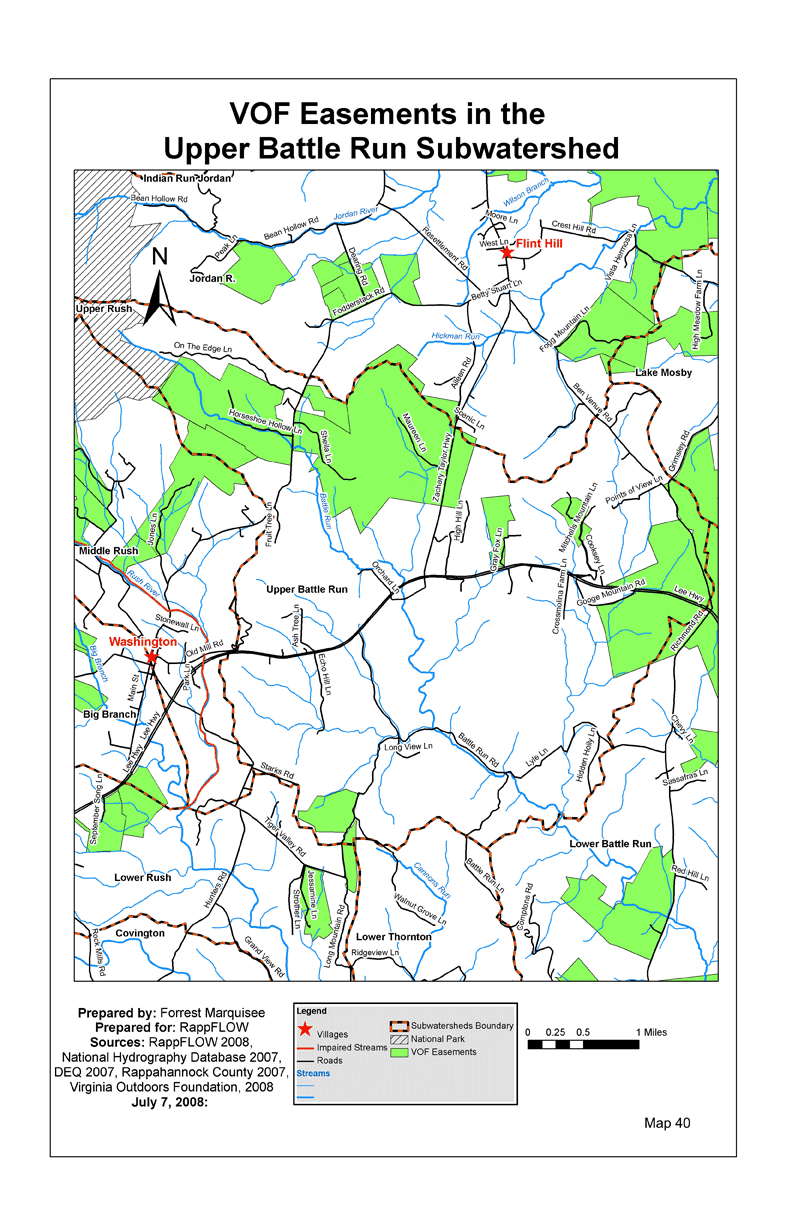
12 Least-protected subwatersheds: Upper Battle Run
13 Questions for Further Inquiry
13.1 Water Quality Questions
13.2 Precipitation and Stream Flow Questions
13.3 Groundwater Questions
13.4 Biological Indicator Questions
13.5 Environmental Services Questions
13.6 Incentives for Agricultural Landowners to Protect the Streams
13.7 Sustainable Forestry Question
14 Goals and Tools for Protecting Vulnerable Watersheds
14.1 Goal 1: Increase monitoring of water quality and water quantity, and make this information accessible to the community
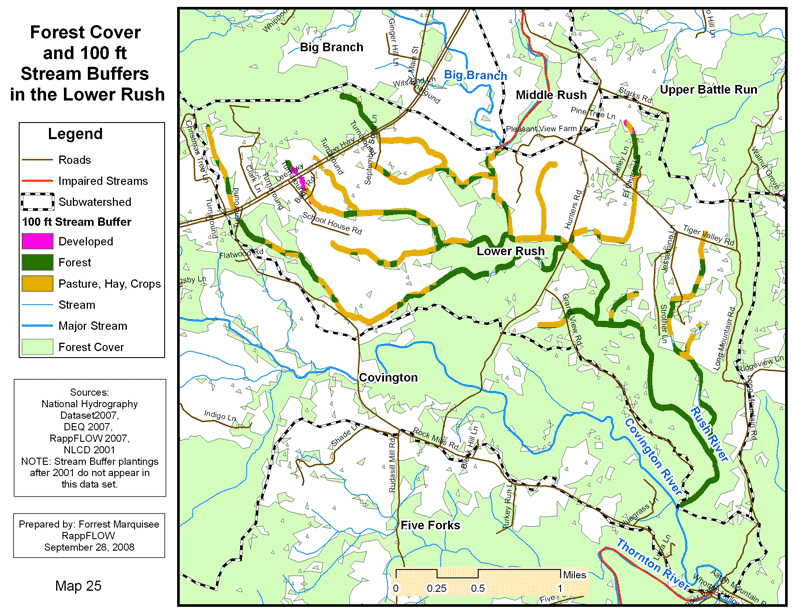
14.2 Goal 2: Increase the percentage of 100-foot riparian buffer zone that is managed to provide protection for streams, from the present 62 % to 80%
14.3 Goal 3: Increase the percentage of privately held land in easement from the present 20% to 40%
List of Maps
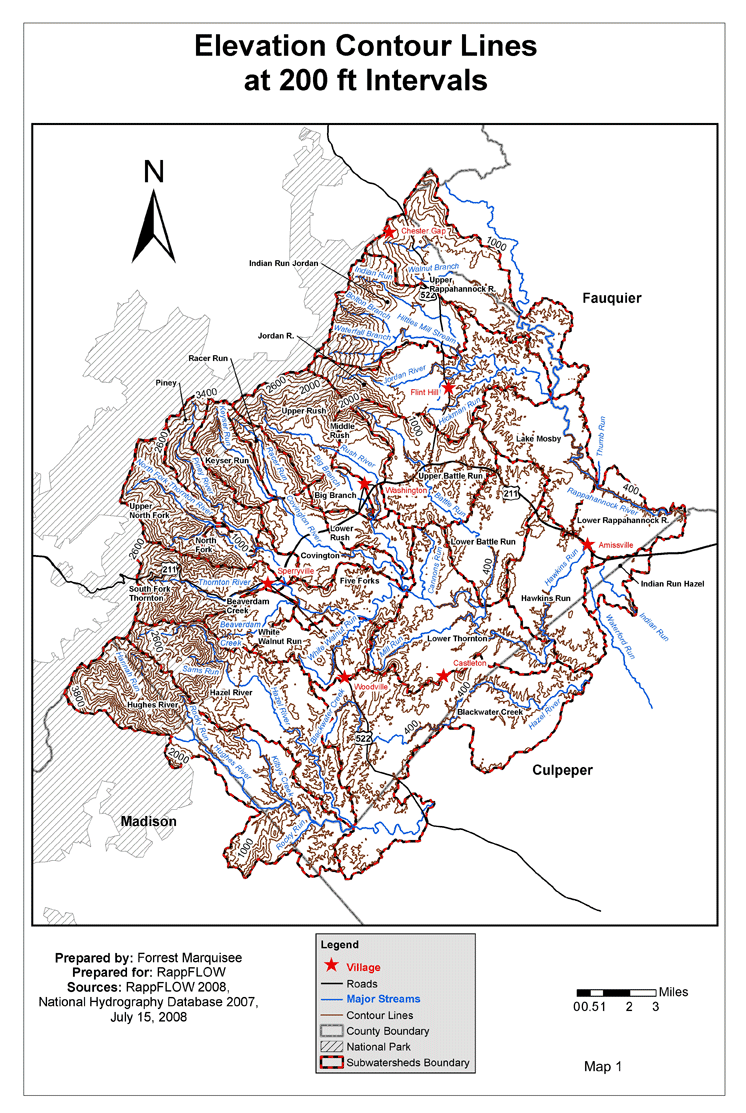
1 Elevation Contours – Rappahannock County
2 Percent of land in Shenandoah National Park
3 Percent of land in Virginia Outdoors Foundation Easement
5 Percent of Land in Forest Cover
7 Percent of Stream Buffer Area that is Forested
9 Percent of Land in Conservation or Agricultural Zones
10 Highly Erodible Soils on Non-forested Land
11 Percent of Land in Highly Erodible Soil on Nonforested Land
13 Subwatershed Protection Assessment
15 Example Road/Stream Crossings
16 Surface Water, Impaired Stream Segments, and Monitoring Stations
18 Lower Rush Subwatershed Surface Water
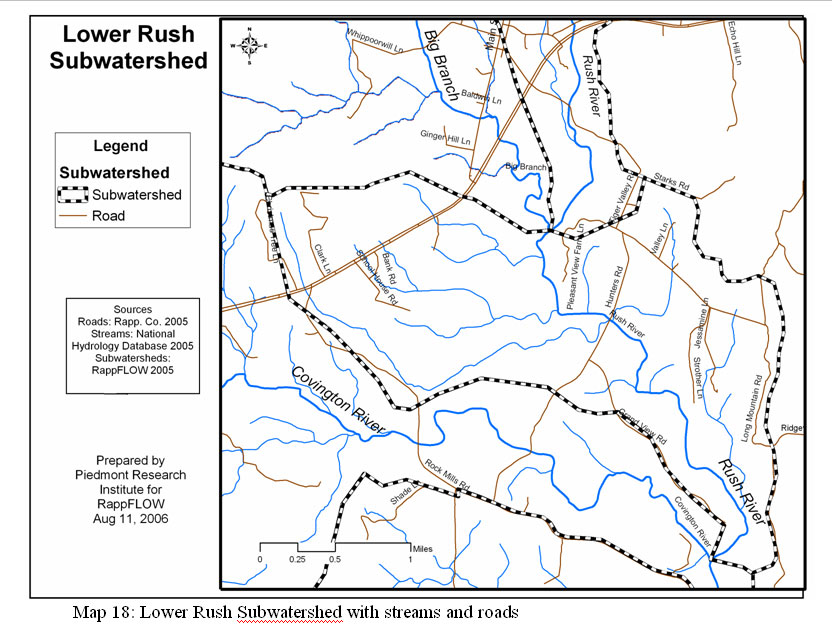
19 Lower Rush Subwatershed Topography
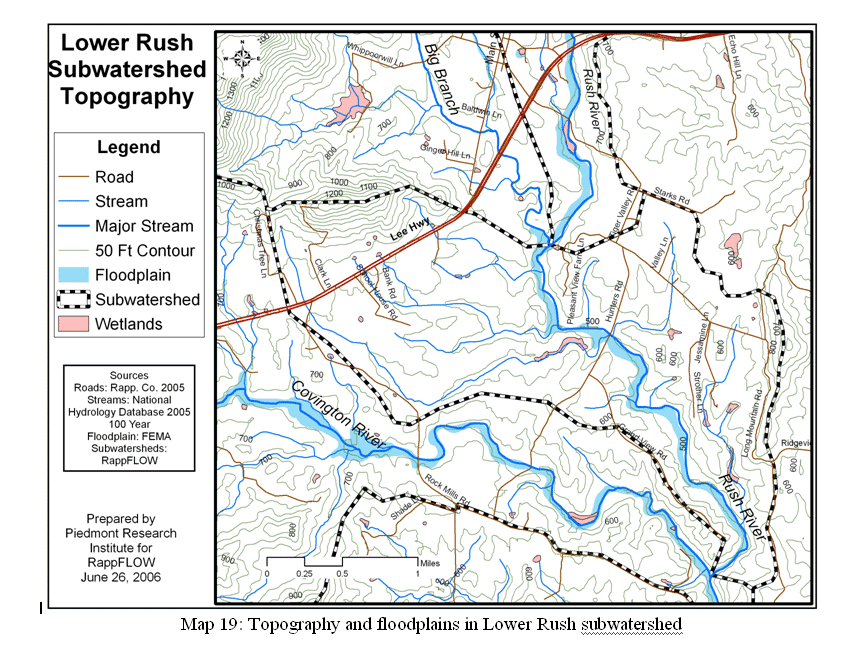
20 Lower Rush Subwatershed Highly Erodible Soils on Nonforested Land
21 Lower Rush Subwatershed Easements
22 Rush River RappFLOW Monitoring for E. coli Bacteria
23 Rush River RappFLOW Monitoring for Dissolved Oxygen
25 Lower Rush Stream Buffer Vegetation
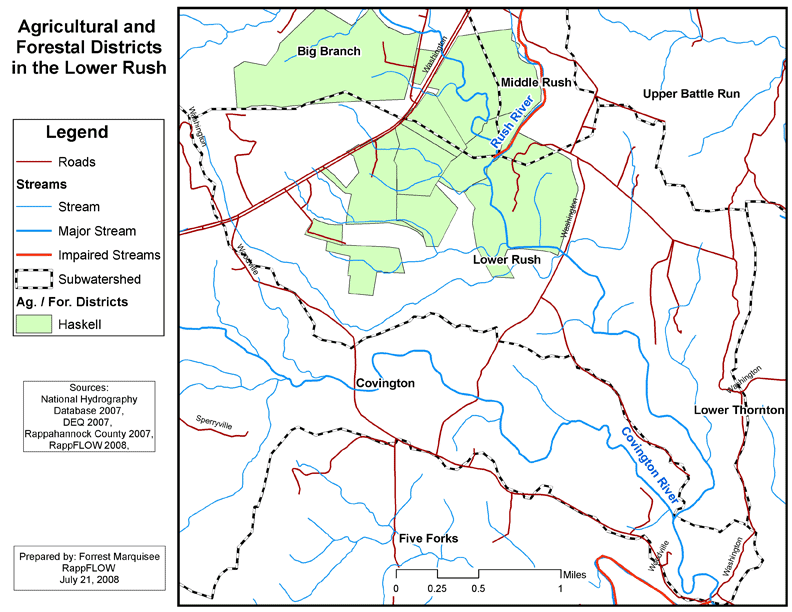
26 Lower Rush Ag/Forestal Districts
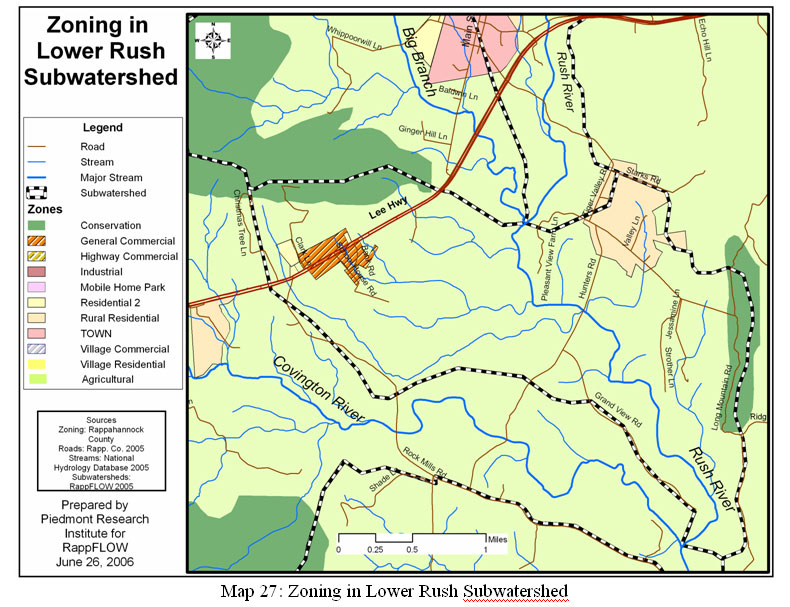
28 White Walnut Run Subwatershed Aerial Photo
29 White Walnut Run Topography
30 White Walnut Run Subwatershed Forest Cover and Stream Buffer Vegetation
31 White Walnut Run Subwatershed Surface Water
32 White Walnut Run Subwatershed Easements
33 White Walnut Run Subwatershed Ag/Forestal Districts
34 White Walnut Run Subwatershed Highly Erodible Soils on Nonforested Land
35 White Walnut Run Subwatershed Zoning
36 Upper Battle Run Subwatershed Aerial Photo
37 Upper Battle Run Topography
38 Upper Battle Run Subwatershed Forest Cover and Stream Buffer Vegetation
39 Upper Battle Run Subwatershed Surface Water
40 Upper Battle Run Subwatershed Easements
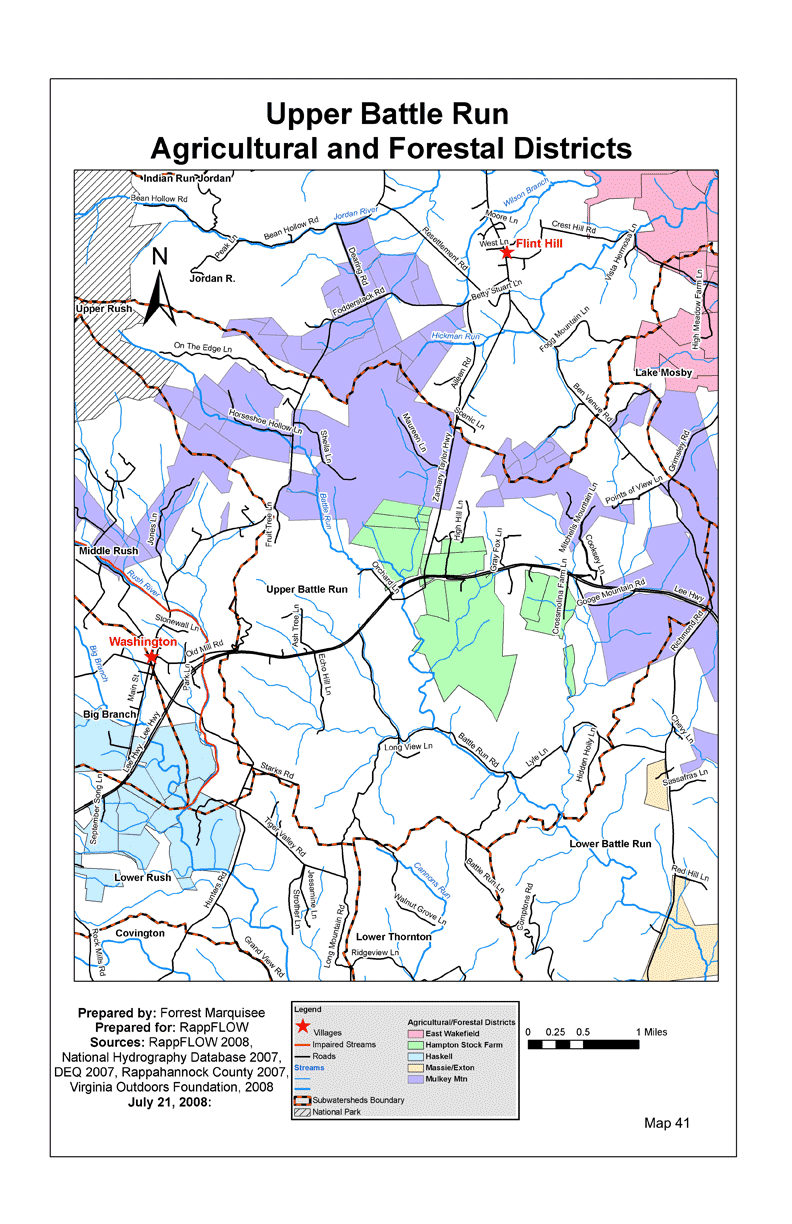
41 Upper Battle Run Subwatershed Ag/Forestal Districts
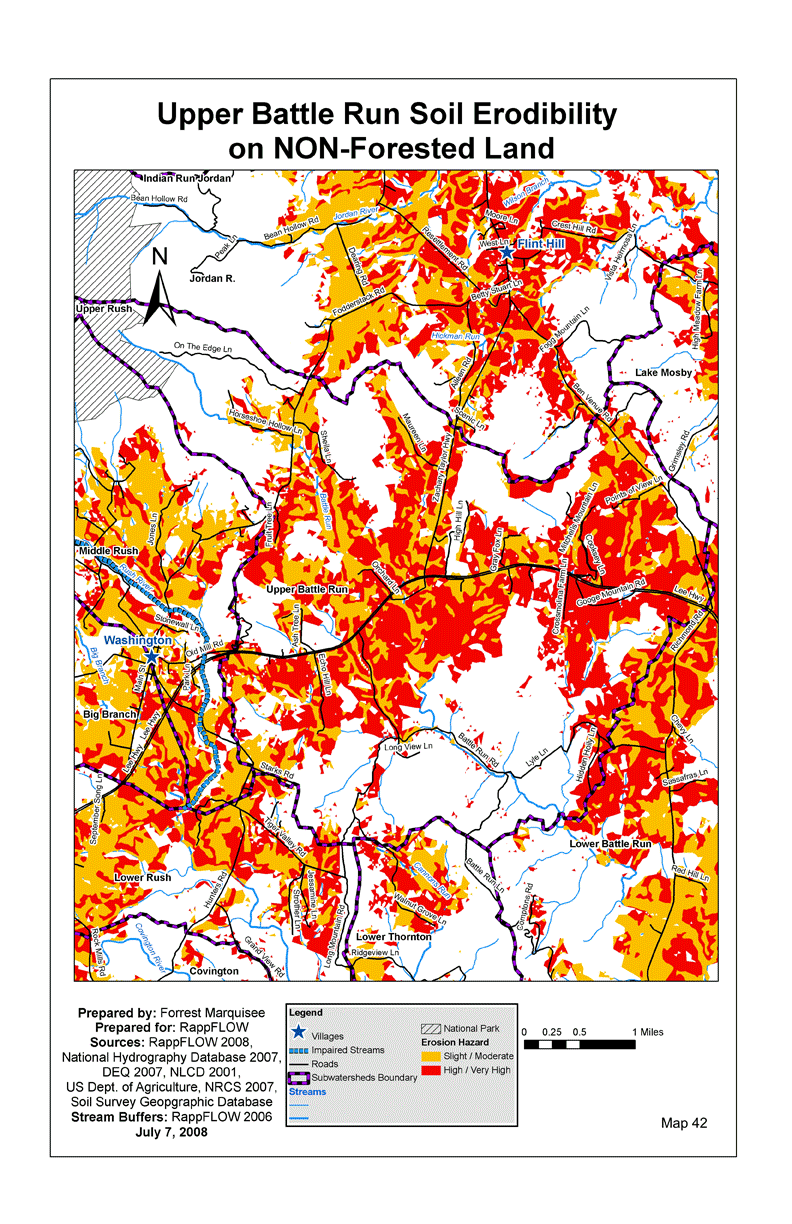
42 Upper Battle Run Subwatershed Highly Erodible Soils on Nonforested Land
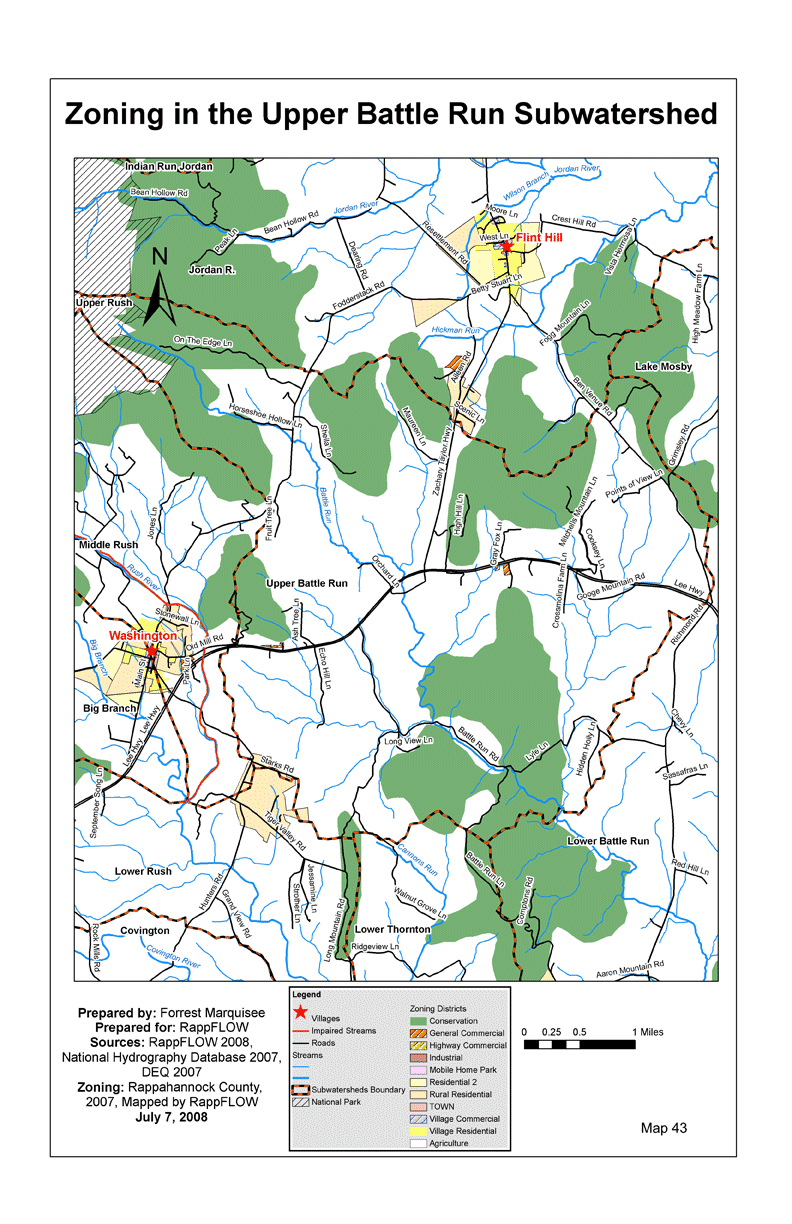
43 Upper Battle Run Subwatershed Zoning